AMD introduced a new graphics add-in board for the entry level this week, the RX 7600, which is the first entry-level addition since the RX 6600 released in October 2021. The RX 7600 is based on the Navi 33 GPU. The Navi 33 is based on a 6nm process with 13,300 million transistors, with a modest 204mm2 die size. The RX 7600 features 2,048 streaming processors and 32 ray-tracing cores, both numbers represent a 14% upgrade over the RX 6600.
AMD is focusing this new board, which has 8MB of GDDR6, for 1080p gaming—AMD reports that 65% of gamers play at 1080p resolution. The MSRP for the RX 7600 is just $269, which is 18% less than the launch price of the RX 6600.
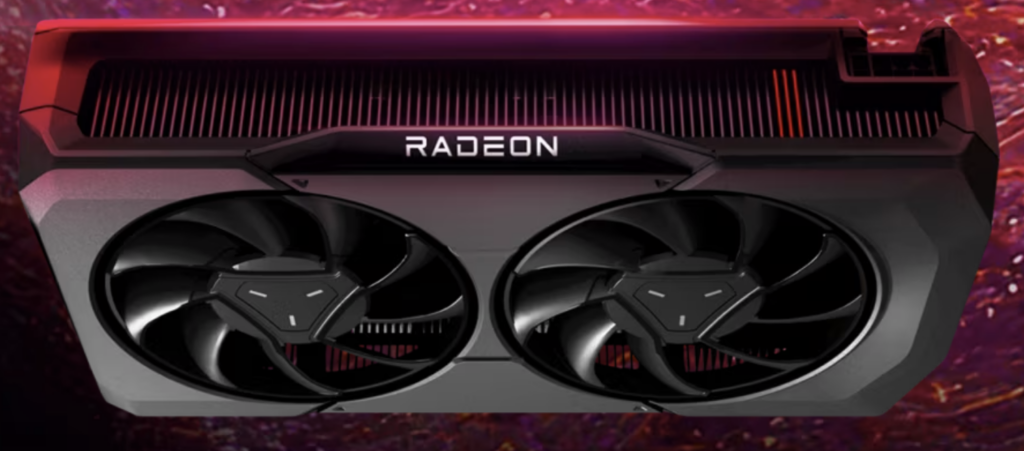
AMD RX 7600 Features and Specifications
The price tag for the RX 7600 may be low, but it offers many attractive features.
- AMD RDNA 3 architecture—Featuring redesigned compute units with unified ray tracing and AI accelerators, along with second-generation AMD Infinity Cache technology, RDNA 3 delivers exceptional performance, visuals, and power efficiency.
- Improved streaming quality and performance—Improved AMD encoders deliver enhanced visual quality when streaming and recording. AMD AI and content adaptive machine learning technology has also been integrated into the AMD Media Framework to enable crisper text when streaming at low bit rates and resolutions.
- Ultra-high-definition encoding—An encode/decode media engine provides the ultimate performance, unlocking new multimedia experiences with full AV1 encode/decode support, wide color gamut, and high-dynamic range enhancements.
- AMD Radiance Display Engine—Provides support for DisplayPort 2.1 on select models and HDMI 2.1a displays for ultra-high resolutions and high refresh rates for gaming and content creation workloads.
- AMD FidelityFX Super Resolution (FSR)—Now available in more than 260 current and upcoming titles, AMD FSR upscaling technologies provide crisp, high-resolution image quality, while boosting frame rates in supported games.
The RX 7600 provides 21.75 FLOPS with a TDP of 165W.
| AIB | RX 7600 | RX 6600 |
| Architecture | RDNA 3.0 | RDNA 2.0 |
| GPU | Navi 33 | Navi 23 |
| Process node (nm) | 6 | 7 |
| Transistors (M) | 13,300 | 11,060 |
| Die size (mm2) | 204 | 237 |
| Streaming cores | 2,048 | 1,792 |
| RT cores | 32 | 28 |
| TFLOPS | 21.75 | 8.928 |
| Base clock (MHz) | 1720 | 1626 |
| Boost clock (MHz) | 2,655 | 2,044 |
| Memory type | GDDR6 | GDDR6 |
| Memory size (GB) | 8 | 8 |
| Memory speed (Gb/s) | 18 | 14 |
| Bandwidth (GB/s) | 288 | 224 |
| TDP (W) | 165 | 132 |
| MSRP | $269 | $329 |
Testing the RX 7600 Against RX 6600.
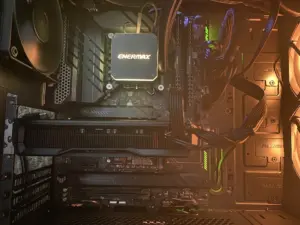
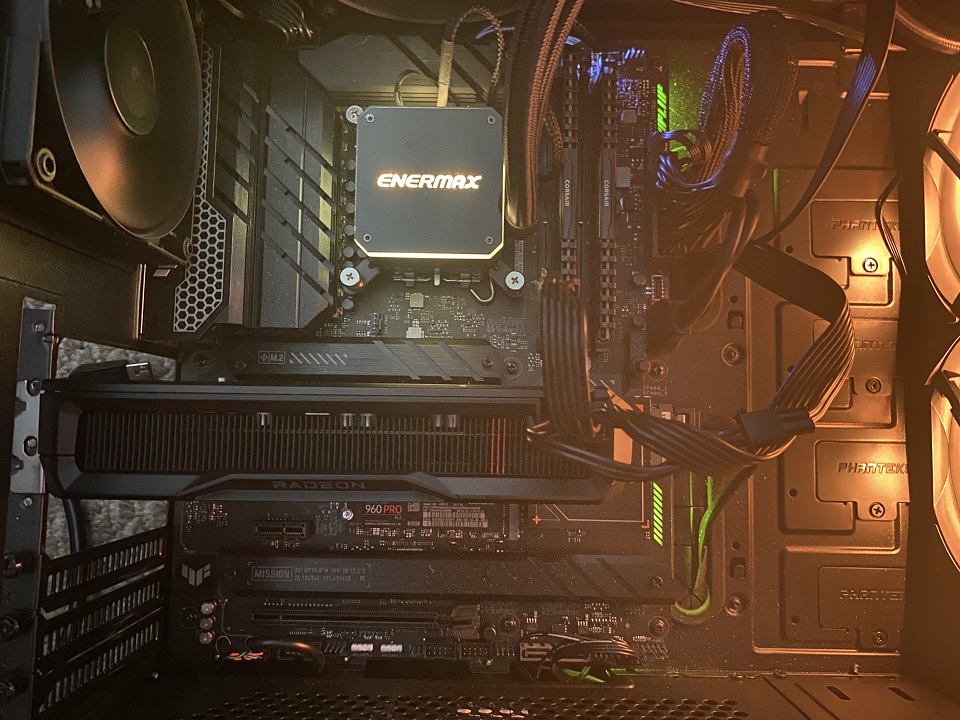
We tested the AIB on an Asus TUF Gaming Z790-Plus motherboard with an Intel 13th-gen Core i9-13900K CPU with 32MB of Corsair Vengeance RAM, running Windows 11 Pro. The SSD is a Samsung 960 Pro. We tested in two resolutions: 1080p and 1440p.
Our test suite consisted of 20 games and synthetic benchmarks.
| 3DMark Timespy | 3DMark DLSS feature test |
| 3DMark Port Royal | 3DMark Speedway |
| 3DMark AMD FSR feature test | Assassin’s Creed: Valhalla |
| Bight Memory: Infinite | Boundary: Benchmark |
| Chernobylite Enhanced Edition | Cyberpunk 2077 |
| Evil Genius 2 | F1 2022 |
| Far Cry 6 | Guardians of the Galaxy |
| Godfall | Metro Exodus Enhanced |
| Red Dead Redemption 2 | Relic of Life |
| Watch Dogs: Legion | Wolfenstein: Youngblood |
Test Suite
Our test results found are as follows.
| RX 7600 | RX 6600 | Percent difference | |
| Avg. FPS games running 1080p | 144.64 | 120.14 | 20% |
| Avg. FPS games running 1440p | 99.21 | 81.21 | 22% |
| 3DMark graphic score averages | 6,068.33 | 4,778.00 | 27% |
The RX 7600 outperformed the RX 6600 by as much as 22% in gaming frame rates.
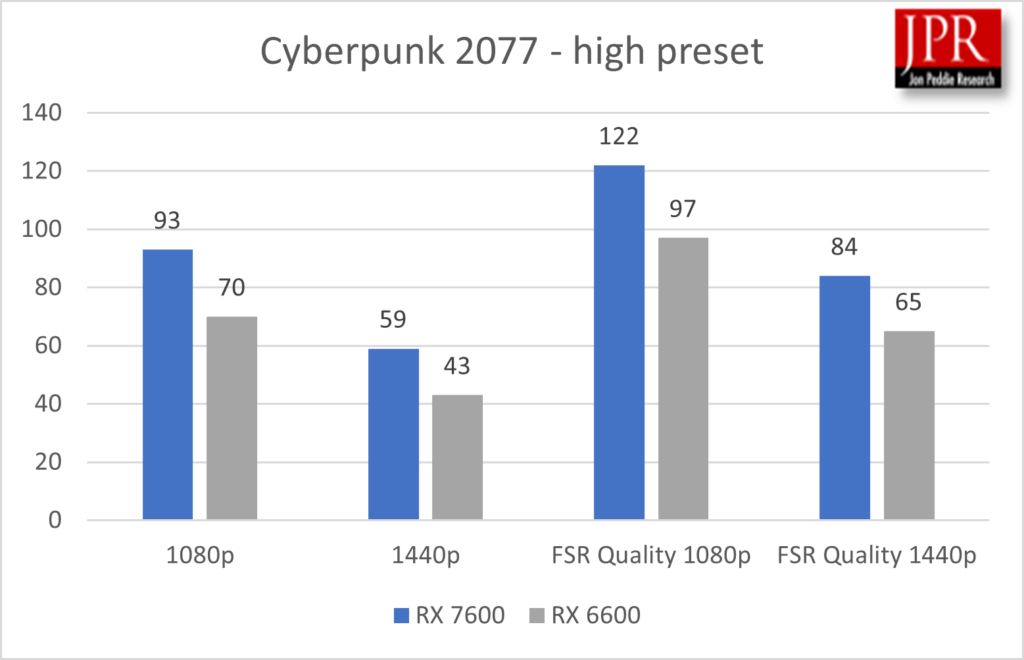
The above graph shows the performance boost provided by AMD’s FidelityFX Super Resolution. FidelityFX Super Resolution provided the RX 7600 with a 42% boost when running Cyberpunk 2077 at high preset in 1440p.
We ran the new 3DMark FSR feature test, which shows the FPS improvement with FSR enabled.
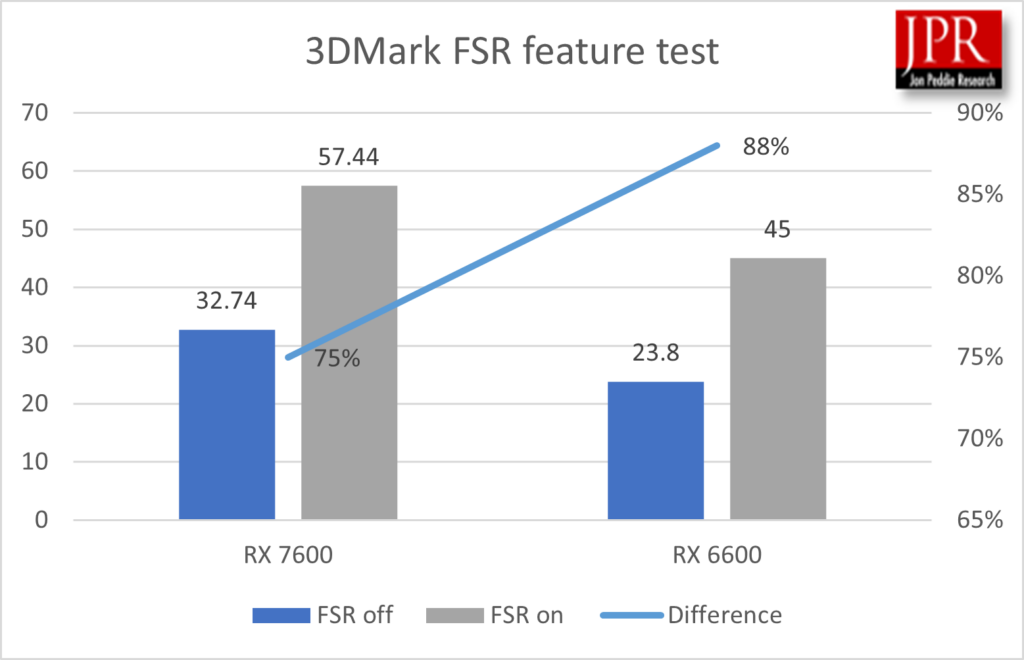
The RX 7600 outperformed the RX 6600 by about 15% in FPS in Guardians of the Galaxy, with FidelityFX providing a massive performance boost for both AIBs when enabled.
Pmark Calculations
JPR has been using its Pmark calculations to compare graphics boards for more than a decade. The Pmark scores factor overall performance of the add-in board and its price and power.

| RX 7600 | RX 6600 | Percent difference | |
| Avg. FPS games running 1080p | 144.64 | 120.14 | 20% |
| Avg. FPS games running 1440p | 99.21 | 81.21 | 22% |
| 3DMark graphic score averages | 6,068.33 | 4,778.00 | 27% |
| TFLOPS | 21.75 | 8.90 | 144% |
| TDP | 165 | 132 | 25% |
| MSRP (at launch) | $269 | $329 | -18% |
Pmark Variables
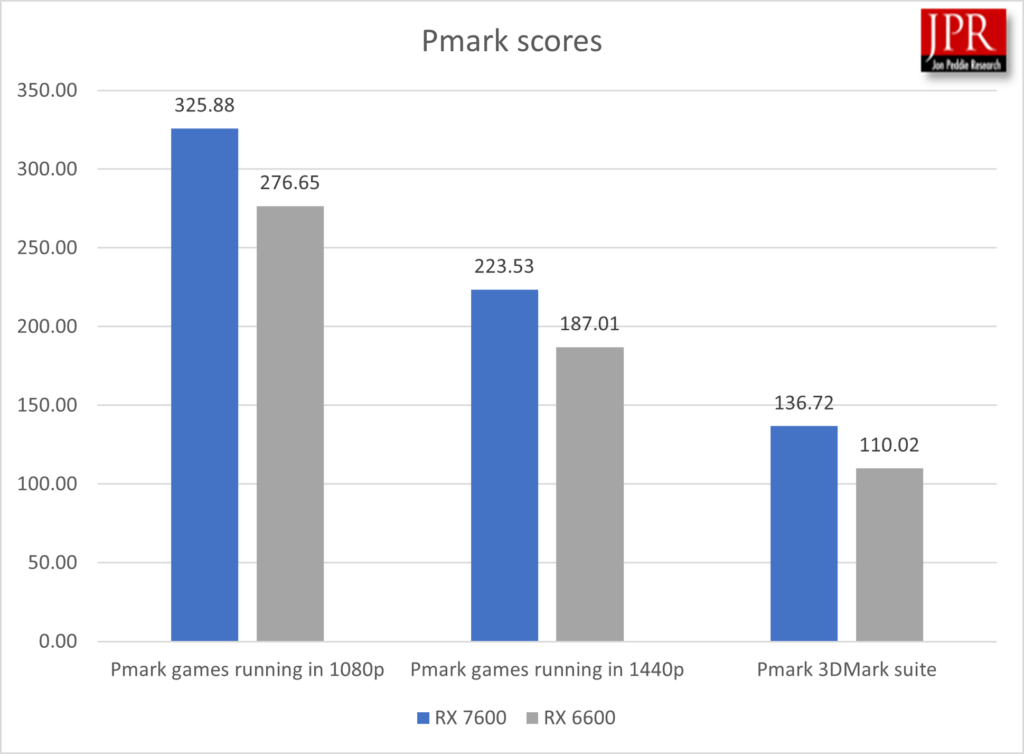
The RX 7600 outperformed the RX 6600 by 18% in the Pmark on games running at 1080p, 20% on games running at 1440p, and 24% in 3DMark tests.
The Jon Peddie Research RX 7600 Rating
We were very impressed with the RX 7600. This is an entry-level-priced AIB targeted at 1080p gaming but still provides solid frame rates at 1440p. It clearly outperforms the RX 6600 yet is priced at 18% less at launch.
AMD is providing a solid value for casual gamers. At $269, it is their most economically priced add-in board since the release of the RX 5500 XT for $169 almost three years ago. The add-in board did not perform well when it came to ray-tracing benchmarks and gaming, but if you are looking for ray tracing, one is usually on the market for a performance segment or high-end graphics board. For $269, the RX 7600 would be very hard to beat.

