Every year, Ericsson commissions a survey on how consumers are using content and video. We were able to get a look at the survey results this year and they make interesting reading. The survey is conducted in nine “trend” markets and 11 additional markets and uses data from interviews, online surveys and user tracking. Ericsson rates the sample as being representative of 680 million people.
 Over 50% of consumers now view streamed content on a daily basis up from 30% in 2010 and, unsurprisingly, 16-34 year olds spend 53% of the time that they watch video on their smartphones. The overall number of those watching video on smartphones has jumped by 71% since 2012 and all users watch, on average, three hours more video on smartphones than that time.
Linear viewing of live TV remains important, with older users watching more linear TV (82% of 60-69 year olds watch linear TV every day, while only 60% of 16-34s also do so). A big trend is to binge viewing of multiple episodes of content, especially where customers have subscriptions for Video on Demand (S-VOD).
A barrier to linear TV is still the problem of finding content, with 62% of consumers from 25 to 34 saying they have this challenge on a daily basis.
Looking at those that have never signed up for Pay TV, Ericsson found that 22% of them are paying for some kind of OTT content services. Streaming has increased hugely from an average of 2.9 hours per week in 2011 to 6.0 hours in 2015 with around half of that being on-demand TV series.
Some new categories of content are becoming significant, with e-sports viewing at 46 minutes per week, and educational or instruction videos are up to 73 minutes per week. Gender differences are mostly small, except in live sport, where men watch just over three hours, compared to one for women. User-generated content is getting more important, especially instructional videos.
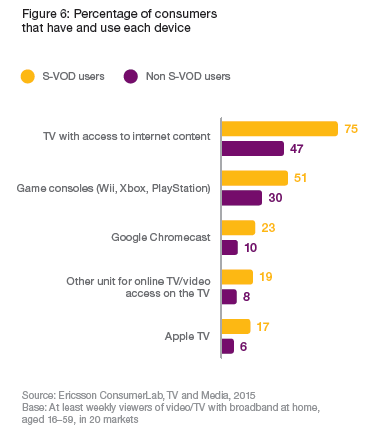
Turning to devices, Ericsson found that for S-VOD customers, connected TVs (we think this includes those that are connected via an STB) are important, with 75% of consumers using them. Next come consoles, then Chromecast. Apple TV is also popular among S-VOD users, with 17% using the device.
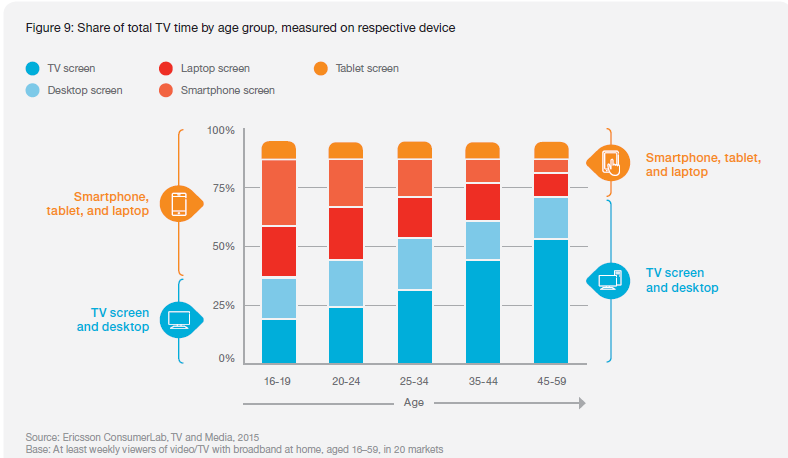
Usage of different devices is also related to age, with a clear shift from mobile devices to TV screens as age goes up. Because of the bigger screens, Netflix users in the US watch 588 minutes on tablets, but only 252 minutes on smartphones. Wi-Fi is the dominant wireless technology, but in the US, 29% of TV and video viewing is provided by mobile broadband rather than Wi-Fi.
In the report, Ericsson highlighted the problems with content discovery. Many viewers can’t find content they want to watch and the firm said that “There is a high level of trust: one in two consumers who have a TV service provider trusts that their provider will handle data securely and responsibly”. 50% of those that watch linear TV say that on a daily basis they “can’t find anything to watch”. In the paper, the company looks at how context, subscriptions and which device is being used can change what the viewer does in this situation. Often, consumers just “revert to habit”.
“Serendipity” – luck and chance – is often a feature of finding content on linear channels, but Ericsson emphasises that content providers can improve serendipity by careful linking of content and enabling social media so that users can get recommendations from family and friends. Viewers are looking for “happy surprises” and hope to see something that they enjoy.
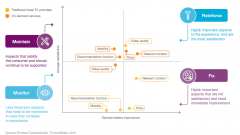
Ericsson said that as consumers get comfortable with using OTT services, they are more likely to move mainstream watching to OTT services. 25% of viewers had “cut or shaved” their TV services in the last year because of cost and OTT is seen as a way of cutting costs. The paper includes a chart showing where Ericsson believes that providers need to take action, based on the importance to customers. Price and content relevance are problems that need fixing for linear TV providers and only 29% of consumers are happy with the programme guide.

In the US, those who use OTT and on-demand services are more likely to recommend them (50%) than linear TV viewers (38%). Although consumers like the idea of being able to “hop on/hop off” from services, 78% say they have never done this. The same percentage would like to get their TV, mobile and internet from a single provider, partly so that they don’t have to think about data caps on mobile use.
Advertising remains an irritation of viewers, especially as Netflix and Amazon Prime are resetting expectations about interruptions.
Analyst Comment
I’m surprised that Ericsson sees 50% of consumers not trusting their TV service provider as a “High level of trust”. It seems to me that if half the customers in an industry don’t trust the people they give money to, that is something of an issue! – BR