Ericsson has released the 2016 version of its ConsumerLab report, a comprehensive survey of 30,000 online and 24 in-depth interviews across 24 countries that the company has published and made freely available. Quite a lot of the value is that the report is published each year, so there is a real sense of the trends in the market.

 The first conclusion, which is no surprise, is that mobile viewing has increased, by four hours per week, since 2012. At the same time, fixed screen viewing has dropped by 2.5 hours, so that means an increase in overall viewing times of 1.5 hours per week. However, scheduled linear TV is still around double any other single way of viewing (the others are downloaded content, streamed content, short clips, DVD & Blu-ray and recorded linear TV). The combination of recorded and scheduled linear TV is still around 50% of the total viewing time.
One of the areas of change since last time and with the sharpest upturn, is an increase in the share of viewers that prefer on-demand over scheduled content, to nearly 60%. In 2010, the number was below 40% and was stable from 2012 to 2014, at just below 40% but grew again in 2015 and 2016. There was also a significant jump in the share of viewers who think that “I need all my TV/Video content when I’m abroad”, and that group increased to nearly 40%.
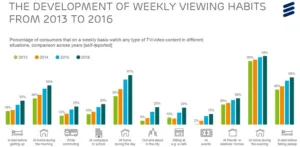
Further highlighting the shift to mobile viewing, respondents reported small increases in viewing at home during the evening, but much bigger increases in viewing at other times and in other places. For example, while only 6% of respondents said in 2012 that they watched TV while “out and about in the city”, that has now risen to 25% (see chart)
Another change is in the way that people segment into different viewer types. Ericsson defines “Mobility Centric” viewers as those that “Firstly and mostly use the mobile screen for all TV/video consumption (except broadcast)”. That segment has risen every year from 2010, when the group was just 5% and has now reached 20% and is bigger than the “TV couch traditionalist” which is down to around 14%.
Turning to the types of content, almost 60% of all active viewing is on movies, TV series and TV programmes, so long form material remains the most important category of content. Live content is increasing and is now around 20% (and comprised of live news, live sports, live events, streamed events and sports, E-sport and live user-generated content). User generated content overall now makes up 10% of active viewing, but it varies a lot according to age. Millenials spend 3.7 hours per week, more than 30 minutes per day, on user-generated content, but this drops to 1.3 hours for the over 35s.
A slight surprise to me was that Ericsson reports that millenials watch more DVD/VHS and Blu-ray than older viewers, at 1.4 hours, compared to 0.9 hours, but this probably reflects that younger viewers expect to have more control of what they watch and when. Millenials already spend 50% of their viewing time watching “on demand” content and 2.5 hours per week on watching streamed on-demand user-generated content.
YouTube is big…
In 2016, 10% of consumers report spending more than 3 hours per day on YouTube with another 30% reporting that they look at YouTube every day (and that rises to 65% in the 16-19 age group!)
… and e-Sport is on the Rise
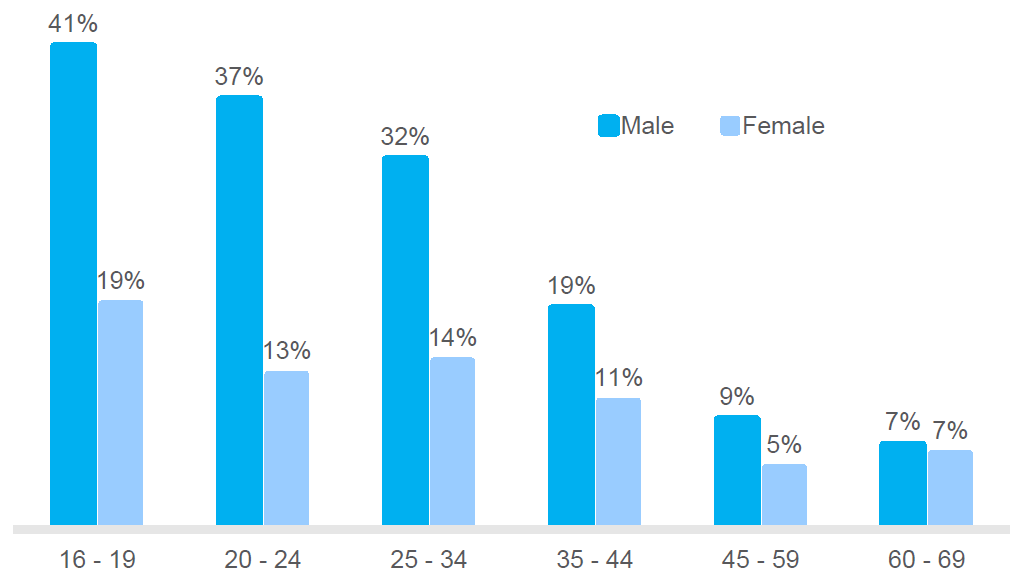
e-Sports attract an increasing number of viewers, but the demographic is very skewed to yong men, with 41% of 16-19 males reporting that they watch e-Sports. However, Ericsson pointed out that even in men aged 35-44, almost one in five watches e-Sports. (I’m clearly in a different group – I have never watched e-Sports!).
Searching, searching….
Searching for content is a perennial topic for Ericsson and the survey suggests that users watching 129 minutes of scheduled broadcast TV spend 23 minutes per day looking for content, the smallest share in the survey. Those looking for on-demand content spend 45% more time searching and Ericsson said that 30% of time spent on VoD is used in looking for content (with AT&T Uverse users spending 34% of their time looking). 44% of users can’t find anything to watch on scheduled TV at least once every day, and that is still 34% even for VOD services.
Video Quality is Still Supreme
The good news for the display industry is that viewers really do care (or say that they care, at least!) about image quality and video quality is ranked as the most important factor in choosing a TV or video service, although only slightly ahead of price (72% vs 71%). Looking at what viewers would pay for, HD quality is also the top feature that viewers consider important, although slightly more are prepared to pay for freedom from ads and commercials.
36% of millenial consumers say that 4K/UHD is worth paying for, while VR TV attracts 24% of them, although for 35+ viewers, those numbers go down to 26% and 17%, respectively. 17% of millenials and 10% of older viewers are prepared to pay for augmented reality.
Unlimited Mobile Streaming is Attractive
Ericsson identified that a lot of consumers would like unlimited accounts for video streaming on their mobile devices.
Finally, in summary, the company said that by 2020, 50% of viewing time will be on mobile screens, 50% of time will be watching on-demand content and 50% of consumers will be Mobility Centrics (defined above) or Screen Shifters (who are happy to move between a range of different screen devices).
If your job depends on video or TV viewing, this document is really worth checking out! (BR)