GfK released data on sales of smartphones in Q3 2017, and reported that global sales volumes reached 367 million units, up 3% year on year, bringing the total to the highest level in a Q3 seen so far as Latin America (up 11%) and Central and Eastern Europe (up 9%) grew strongly. In an unusual development, ASPs increased by 7% year on year.
Arndt Polifke, global director of telecom research at GfK said
“The industry has clearly been switching its focus to drive sales value, and top tier global brands, such as Apple, Google, HTC, Huawei, LG, Moto, Nokia, Samsung and Sony, either already have, or will release, new premium models in an effort to upsell customers to their flagship devices. At the same time, premium features are increasing in importance to consumers, so we expect to see more emphasis on water and dust protection, battery power and memory, high resolution sound, camera and video capabilities, bezel-less design and even biometric sensors on new launches.”
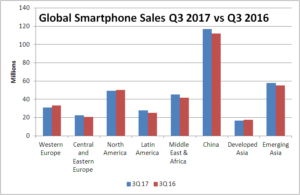
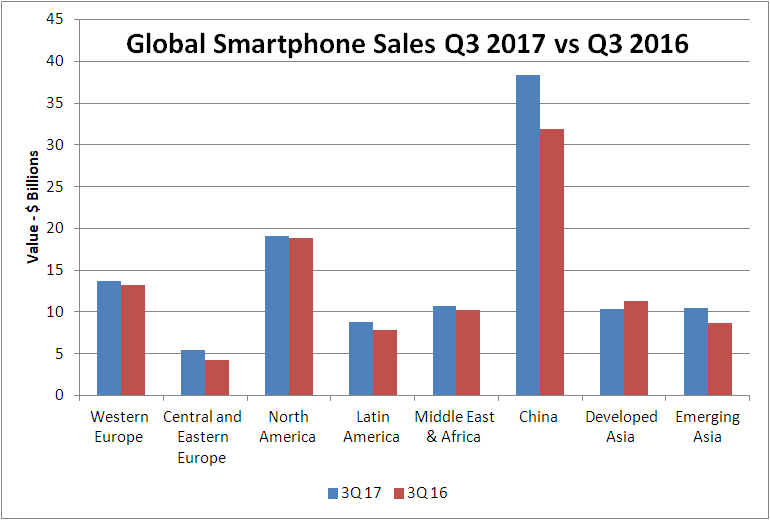
| Smartphone sales 3Q 2017 vs. 3Q 2016 |
Units sold (in million) | Sales value (in billion USD) | ||||
|---|---|---|---|---|---|---|
| 3Q17 | 3Q16 | Y/Y % change | 3Q17 | 3Q16 | Y/Y % change | |
| Western Europe | 30.9 | 33.2 | -7% | 13.7 | 13.2 | 4% |
| Central and Eastern Europe | 22.3 | 20.5 | 9% | 5.4 | 4.3 | 26% |
| North America | 49.3 | 50.0 | -1% | 19.1 | 18.9 | 1% |
| Latin America | 27.8 | 25.1 | 11% | 8.8 | 7.8 | 13% |
| Middle East & Africa | 45.2 | 41.9 | 8% | 10.7 | 10.2 | 5% |
| China | 117.0 | 111.9 | 5% | 38.3 | 31.9 | 20% |
| Developed Asia | 16.4 | 17.6 | -7% | 10.3 | 11.3 | -9% |
| Emerging Asia | 57.7 | 55.2 | 5% | 10.5 | 8.7 | 21% |
| GLOBAL | 366.6 | 355.4 | 3% | 116.8 | 106.3 | 10% |
| Source: GfK Point of Sales (POS) Measurement data in 75+ markets, monthly data to the end of August 2017, plus weekly data to 30 September 2017.%ages are rounded. | ||||||
Western Europe: Revenue grows despite market saturation
Smartphone demand totaled 30.9 million units in 3Q17 in Western Europe, down 7% year-on-year. The combination of the saturated market and delayed launch of the iPhone X has led to a year-on-year decline for the fourth consecutive quarter.
Demand in Germany is set to decline by 7% year-on-year and both Great Britain and France are expected to experience an 8% fall. However, sales value in the region rose 4% year-on-year, driven by an 11% increase in ASP.
As a result, GfK raised its 2017 smartphone revenue outlook for the region to 6% year-on-year. The shift towards very high end devices is a clear trend in this region, with one out of eight smartphones sold in this quarter priced above $900, compared to one out of 16 in 3Q16.
Central and Eastern Europe: Revenue up 26%
Smartphone demand continues to recover in Central and Eastern Europe, with a 9% increase year-on-year in 3Q17, bringing demand to 22.3 million units. Sales value, however, increased at a faster rate of 26% year-on-year, driven by a shift in consumer demand towards higher-priced devices.
The improvement in the region’s demand in 3Q17 is mainly due to strong growth in Russia (up 10% year-on-year) and the Ukraine (up 19% year-on-year).
The outlook is also positive, with 2017 smartphone demand forecast to grow 9% year-on-year to 85.2 million.
North America: A slight fall in 3Q17 but a positive outlook to round the year off
In North America, smartphone demand totaled 49.3 million units in 3Q17, down 1% year-on-year. This represents a return to decline, following growth in 2Q. However, the outlook for 4Q17 is positive, as major product releases have been announced for this quarter.
GfK forecasts 2017 smartphone demand to total 201 million units, a growth of 1% year-on-year.
Latin America: Brazilian sales give the region a boost
In this region, smartphone demand reached 27.8 million units in 3Q17, a rise of 11% year-on-year. Demand in Brazil remains the driver of this sterling regional performance. Brazil experienced a 17% increase in demand in 3Q17 compared to the previous year.
GfK has raised its 2017 forecast for Latin America to growth of 9% year-on-year.
Middle East and Africa: Egypt returns to growth
Smartphone demand totaled 45.2 million units in the Middle East and Africa, up 8% year-on-year. This increase in sales has been driven by a faster-than-expected recovery in Egypt, where demand returned to growth in July 2017 for the first time since November 2016.
Overall, GfK forecasts smartphone demand to grow by 5% year-on-year in 2017. This is driven primarily by Sub-Saharan and South African countries, where smartphone penetration remains relatively low.
China: Unit demand up, with prices set to increase further as new models are launched
In China, smartphone revenue is up 20% year-on-year in 3Q17. This growth was driven by a 15% year-on-year rise in ASP, while demand increased 5% year-on-year, reaching 117 million units. Launches from key domestic brands that were postponed to 3Q17 contributed to the positive performance of this quarter.
Overall, smartphone demand in China is expected to total 464 million in 2017, a growth of 4% year-on-year. In value terms (USD), 16% year-on-year growth is forecast.
Developed Asia: Declining demand in South Korea continues to bite
Smartphone demand in the region reached 16.4 million units in 3Q17, down 7% year-on-year, weighed-down by a 15% year-on-year decline in South Korea.
GfK’s 2017 forecast for the region has been lowered to minus 4% year-on-year, with smartphone demand totalling 70.1 million units.
Emerging Asia: Still on track to post the strongest growth across all regions in 2017
In emerging Asia, smartphone revenue increased 21% year-on-year in 3Q17, while demand increased 5% year-on-year, reaching 57.7 million units.
Demand growth in India and Indonesia in the quarter moderated to 3% and 5%, respectively, year-on-year. In Malaysia demand grew by 25% year-on-year, representing the sixth consecutive quarter of growth. Bangladesh also saw strong demand in the quarter, with growth of 22% year-on-year.
GfK forecasts smartphone demand in emerging Asia to total 238 million units in 2017 (up 11% year-on-year), the strongest of all regions this year.
| Smartphone sales 2017 vs. 2016 |
Units sold (in million) | Sales value (in billion USD) | ||||
|---|---|---|---|---|---|---|
| 2017 sales | 2016 sales | Y/Y % change | 2017 sales | 2016 sales | Y/Y % change | |
| Western Europe | 126.7 | 131.0 | -3% | 56.6 | 53.5 | 6% |
| Central and Eastern Europe | 85.2 | 78.0 | 9% | 21.0 | 16.8 | 25% |
| North America | 201.1 | 198.5 | 1% | 80.6 | 77.5 | 4% |
| Latin America | 115.4 | 105.9 | 9% | 36.2 | 30.9 | 17% |
| Middle East & Africa | 176.8 | 168.9 | 5% | 41.9 | 42.1 | 0% |
| China | 464.3 | 448.5 | 4% | 154.3 | 133.1 | 16% |
| Developed Asia | 70.1 | 72.9 | -4% | 44.7 | 46.1 | -3% |
| Emerging Asia | 238.6 | 214.5 | 11% | 43.0 | 34.5 | 25% |
| GLOBAL | 1,478.2 | 1,418.2 | 4% | 478.3 | 434.5 | 10% |
| Source: GfK Point of Sales (POS) Measurement data in 75+ markets, monthly data to the end of August 2017, plus weekly data to 30 September 2017. Percentages are rounded. | ||||||