OLED panel revenues increased by 4% in 2019 to $27.9 billion, according to the latest update of the DSCC Quarterly OLED Shipment Report for Q1 2020, with double-digit growth in area, as OLED continues to take a larger share of smartphone and TV shipments.
The Q1 update of this report gives DSCC’s revised forecast for 2020-2025 for eleven different applications for OLED panels, with detailed figures for units, revenue, area, average selling price (ASP), and other parameters with splits by application, panel supplier, substrate (rigid/flexible/foldable) and brand. The report also provides final figures for Q4’19 and for the full year 2019 with the same detail.
Q4’19 Results
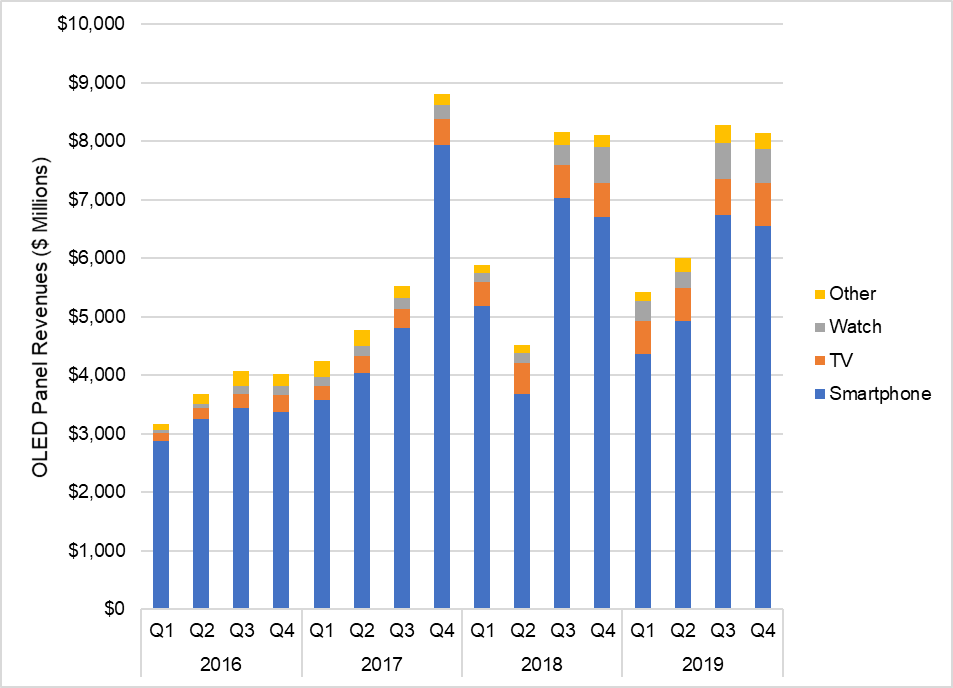
OLED panel revenues came in at $8.1 billion in Q4’19, down a slight 2% from Q3 and flat compared to Q4 2018, as shown in the first chart here. Revenues from smartphone panels amounted to $6.5 billion, a 2% decline from the prior year figure, but revenues for TVs were up 30% Y/Y to $752 million. During 2018, smartwatch continued as the clear #3 application for OLED revenues and established strong growth for the full year. However, in signs that the growth may have plateaued, Q4 revenues of $573 million were down 7% Y/Y. Revenues from all other applications increased by 31% to $281 million.
Quarterly OLED Panel Revenues by Application, 2016-2019
The decline in OLED smartphone panel revenues in Q4 was a result of lower ASPs for both rigid and flexible panels. In unit terms, OLED smartphone panel shipments in Q4 came in at 124 million, a 4% increase over Q4 2018, and OLED panels for all applications amounted to 162 million, a 10% increase over the prior year. Smartwatches helped the unit figure with a 37% Y/Y increase to 31 million units, and while TVs do not add much to the unit total, OLED TV panel units grew 22% to 998 thousand.
OLED panel shipment area reached an all-time high of 2.3 million square meters in Q4, up 2% Q/Q and 17% Y/Y. Smartphone panel area increased 11% to 1.2 million square meters, while TV panel area increased 26% to 974,000 square meters.
Among OLED smartphone panel suppliers, Samsung continued to dominate shipments, with nearly 103 million units or an 83% share, but their shipment share declined from 90% in Q4 2018 as shipments by other players increased. LGD came in 2ndplace with 6.8 million or a 5% share on increased shipments to Apple, closely followed by Visionox with 6.0 million, also 5%. BOE, which in the first half of 2019 had shipped more than 10 million OLED smartphone panels, sold only 2.1 million in Q4, for 2% share, on loss of share at Huawei. However, BOE’s volumes are expected to nearly triple in Q1’20 as it gains ground at other Chinese brands and rebounds at Huawei.
Full Year 2019 Results
For the full year 2019, OLED revenues increased 4% from 2017 to $27.9 billion. Smartphone panels continued to dominate the revenue picture with $22.5 billion in 2018, but this number was flat compared with 2018. OLED TV panel revenues, driven by growing volumes and a richer screen size mix, increased 21% Y/Y to $2.5 billion and OLED smartwatch panel revenues increased 42% to $1.8 billion. The revenue for OLED panels in all other applications increased by 34% to $974 million, as revenues increased in notebooks and VR headsets.
OLED unit shipments increased 15% for the full year 2019 to 577 million, with smartphones again dominating the numbers, but again showing slower growth. OLED smartphone panels reached 466 million units in 2018, a 7% increase over 2018, while smartwatches increased 74% to 88 million and TVs increased 16% to 3.4 million.
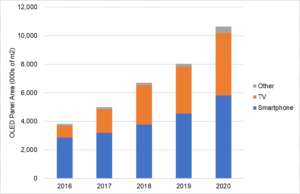
OLED panel shipment area increased 20% Y/Y to 8.0 million square meters. Smartphones continued to be the largest application for OLED display area, representing 56% of the total at 4.5 million square meters, and smartphone panel area growth slightly outpaced the rest of the industry at 21%. OLED TV panel area, which was constrained by capacity, increased by 18% Y/Y to 3.3 million square meters, and remained at 41% of all OLED area for the year.
Among smartphone panel suppliers, Samsung shipments declined slightly in unit terms from 2018 to 2019 to 406 million (a 1% drop, although total area increased by 13% on larger screens), and their share slipped from 94% to 87%. BOE took 2ndplace with 15 million units or a 3.3% share, and Visionox placed 3rdwith 12.5 million or a 2.7% share.
2020 Forecast
DSCC expects area shipments to increase by 32% in 2020 to 10.6 million square meters, with strong growth in both smartphones and TVs, as shown in the next chart, with smartphone area growth of 28% added to TV area growth of 34%. TVs will continue to represent 41% of area shipments in 2020, with smartphones at 55%. The area for all other applications will increase by an impressive 99% in 2020, but will still amount to only 4% of total area.
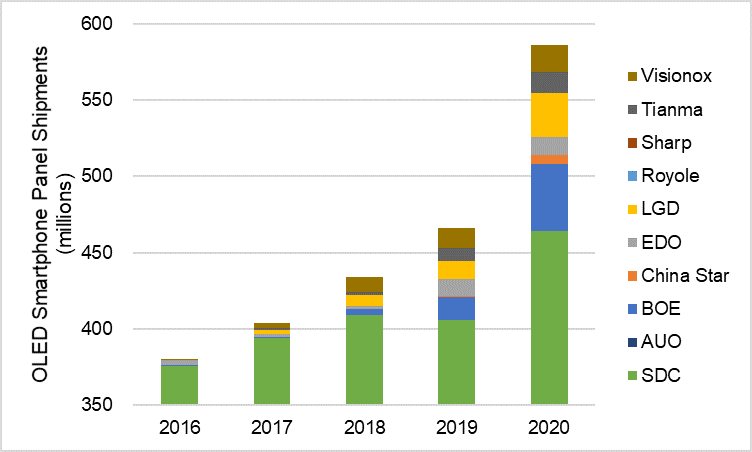
We expect Samsung to continue to dominate OLED smartphone panels in 2020, but their share to continue to erode as others increase shipments and capacity. We expect Samsung to increase shipments by 14% to 464 million or a 79% share, and expect BOE to nearly triple their shipments to 44 million or a 7.5% share. We expect LGD to pass Visionox for 3rdplace among panel suppliers with 29 million or a 4.9% share.
OLED Panel Shipment Area, 2016 – 2020
OLED revenues across all applications are forecasted to increase 35% Y/Y to $37.6 billion in 2020, with smartphone panel revenues increasing at 36% to $30.7 billion, and the smartphone share of OLED panel revenues increasing slightly to 82%. TV panel revenues are forecast to increase by 28% to $3.2 billion, with their share of OLED revenues stable at 9%, and smartwatch revenues are forecast to increase by 11% to $2.0 billion, representing 5% of the industry total. The revenues for all other OLED applications are expected to increase by 69% in 2020 to $1.6 billion, with substantial growth in notebook panel revenue leading the way.
In unit terms, OLED panel shipments are forecasted to increase by 27% to 731 million, with smartphone panel shipments growing by 26% to 586 million or 80% of the total, and smartwatches growing by 28% to 112 million or 15% of the total. TV units, while they will remain less than 1% of the total in unit terms, are expected to grow by 33% to 4.5 million.
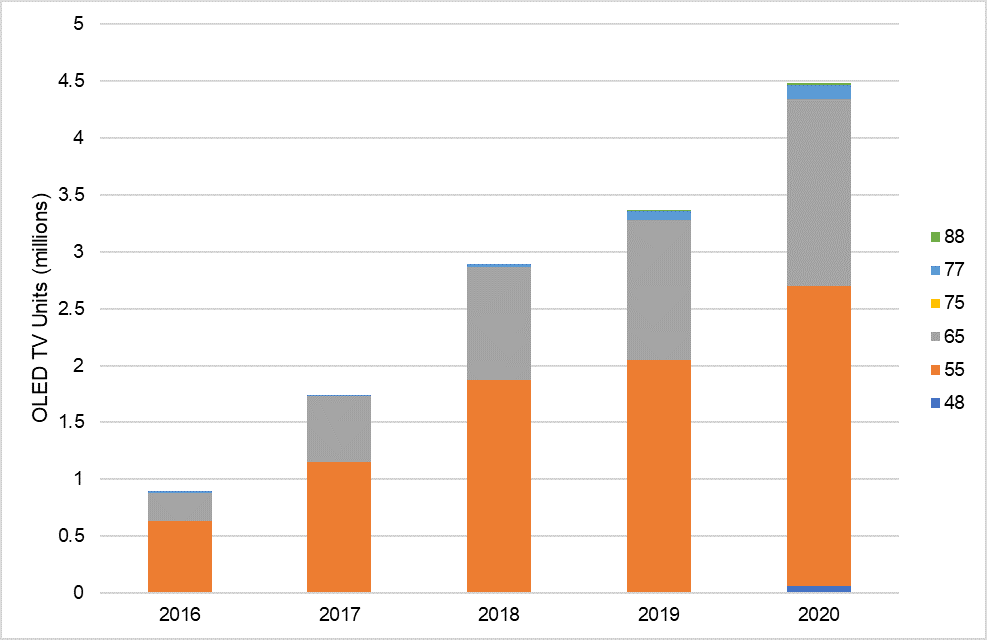
As shown in the next chart, OLED TV panel shipments grew 16% in 2019 to 3.4 million units, with growth across all screen sizes but constrained by capacity limitations as LGD’s G8.5 fab in Guangzhou has started production later than expected. In 2020, we expect that growth will increase to 33% to 6.8 million as LGD ramps its G8.5 fab in Guangzhou, China. We forecast that 55” TV panels will increase 29% in 2019 to 2.6 million, while 65” will increase 33% to 1.6 million and 77” will increase 73% to 126,000 units. We forecast that the 48” screen size, to be introduced in 2020, will remain a minor part of the TV picture with only 63,000 units.
OLED TV Shipments 2016-2020
The DSCC Quarterly OLED Shipment Report includes far more detail than these top-line figures show such as details by panel maker. The next chart shows OLED smartphone panel shipments by panel maker for 2016-2019 with our forecast for 2020 (note the offset horizontal axis – otherwise Samsung dominates the chart too much). While Samsung will continue to dominate the industry with 79% of all unit shipments in 2020, their share will erode from 87% in 2019, and 94% in 2018 as shipments from all non-Samsung panel makers will increase by 103% Y/Y to 122 million units, with BOE, LGD and Visionox staking out the #2 through #4 positions, respectively.
OLED Smartphone Panel Shipments 2016-2020
Beyond smartphones, several panel makers have substantial shares of smartwatches. EverDisplay (EDO) led this category in 2019 with 21.2 million units, edging out LGD at 20.1 million while BOE and Samsung shipped 15.0 million and 13.5 million, respectively. We expect that EDO will maintain its lead in unit shipments in 2020 with 23.5 million, but BOE is expected to surpass LGD for the #2 position with 21.7 million units, pushing LGD into the #3 position with an expected 15.1 million units in 2020. Samsung is expected to take the #4 position in this category in 2020 with 14 million units.
While the main focus of the report is OLED, the report also includes data by major brand for LCD smartphone panels as well, as shown in the last chart. We expect OLED panel shipments to Apple to increase by 80% Y/Y to 107 million units with three new OLED models to be introduced in fall 2020, while LCD smartphone panel shipments to Apple will decline by 35% to 102 million. Shipments to Samsung Mobile will decline in 2019 in both OLED and LCD, by 2% and 3%, to 195 million and 124 million, respectively.
Smartphone Panel Shipments to Major Brands, 2016-2020
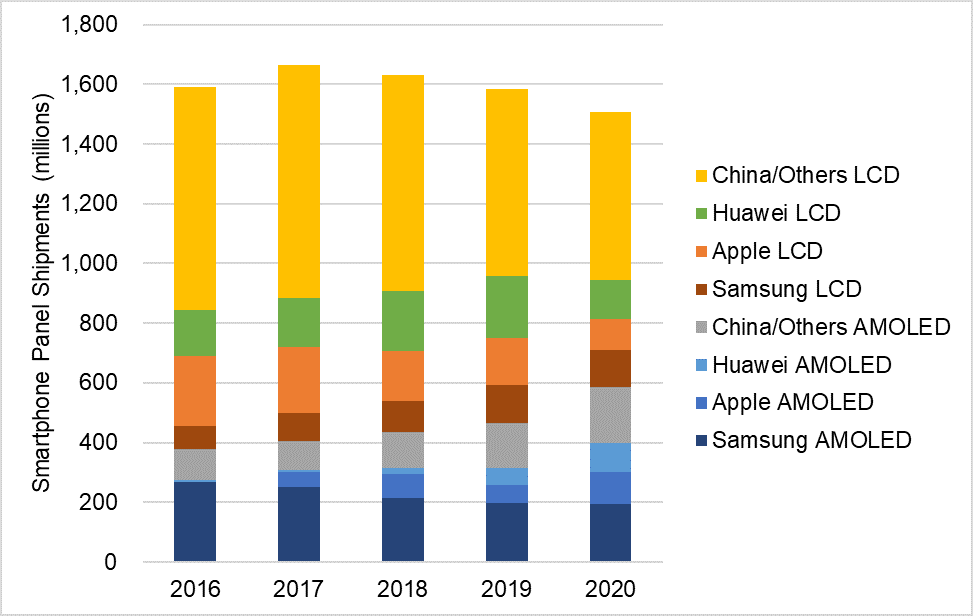
The main growth in OLED smartphone panel shipments will come from shipments to China brands and Other brands. OLED shipments to Huawei are expected to increase 74% to 98 million units, and OLED shipments to other brands are expected to increase 22% to 187 million units. LCD panel shipments to Huawei are expected to decline by 36% to 133 million, and LCD panel shipments to other brands are expected to decline by 11% to 561 million units. As can be seen on the chart, the total panel shipments for smartphones are expected to decline Y/Y because of the coronavirus impact (before the virus hit, we were forecasting an increase Y/Y in 2020); we expect a total of 1.51 billion panel shipments in 2020.
The DSCC Quarterly OLED Shipment Report also includes our forecast for OLED shipments by application by quarter in 2020 and by year from 2021-2025; we will cover the long-term forecast for OLED shipments in a future article.
As noted above, the DSCC Quarterly OLED Shipment Report provides a comprehensive listing of historical panels shipments for all applications, plus a forecast of units, ASPs, screen sizes, resolutions, panel suppliers, and revenues for each application. Readers interested in subscribing to the DSCC Quarterly OLED Shipment Report should contact [email protected].

