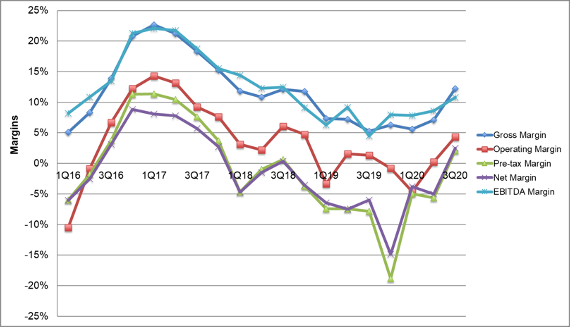
The increase in LCD TV panel prices led to big improvements in industry margins in Q3 as shown in the next chart which takes a longer view back to 2016. Q4 2019 saw pre-tax and net margins in the industry hit new depths, as big asset impairments by LGD and CEC Panda drove these metrics down sharply.
Operating margins hit a low of -4% in Q1 but bounced back to breakeven in Q2 and positive in Q3, and EBITDA and gross margins increased to the double digits.
Note that these margin figures exclude certain companies from certain metrics: for example, Samsung reports Operating Margin for its display business, but not pre-tax or net margin. Nevertheless, the series are consistent over time, clearly demonstrating the industry’s long descent from 2016-2019 and modest recovery in the first three quarters of 2020.
Display Industry Margins, Q1 2016 to Q3 2020
Gross profits for displays jumped sequentially in Q3, with a 106% increase Q/Q to $2.7 billion, up 182% Y/Y. Every panel maker reported improved gross margins in Q3, and every panel maker except CPT China reported positive gross margins. HannStar made the most impressive jump from 2% to 37% gross margin, but margins for AUO and LGD also increased to the double digits.
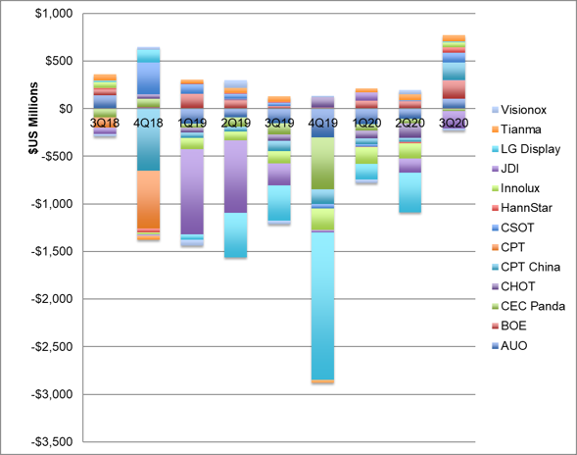
Display industry operating margins in recent years have been dominated by Samsung Display. In Q3 2019, for example, SDC’s operating profit of $983 million represented more than 200% of the industry total of $454 million. While SDC again reported the highest operating profits in the industry in Q3, nine of the thirteen panel makers reported operating profits, and Samsung’s total represented only 30% of the industry total. Display industry operating results recovered to a profit in Q3 of $1.33 billion, the best result since Q4 2018.
Panel Maker Operating Results, Q3 2018 to Q3 2020
Net profit figures exclude Samsung, CSOT, and Sharp, which do not report net profits of their display businesses, but the rest of the display industry posted a net profit of $545 million in Q3 2020, the first net profit after seven consecutive quarters of net losses for the industry. The industry total was helped by a big net profit from CPT China, which reported an extraordinary gain of CNY 1.46 billion ($211 million) on an asset disposal, and therefore reported a net profit despite an operating loss.
Panel Maker Net Profits or Losses, Q3 2018 to Q3 2020

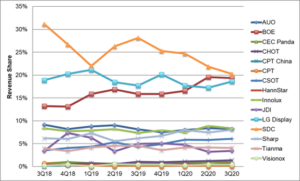
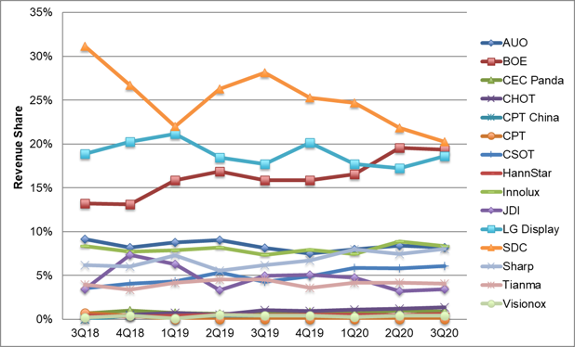
Six different companies in the industry provide area pricing in their financial statements, and among these six the range of pricing is almost a factor 10. Large LCD panels, and specifically LCD TV panels, have the lowest area prices in the industry, and companies that rely heavily on LCD TV typically have the lowest prices per square meter. CSOT has the lowest average area price in the industry, with a Q3 price of $249 per square meter, but this is an average of $1544 per square meter for small panels and only $168 per square meter for large panels.
The area prices for all six panel makers increased in Q3, helped by the increases in LCD TV panel prices. Tianma’s average price remains more than 3 times as high as any other company in the industry reporting these results, because their product and application mix emphasizes higher priced panels.
In terms of area shipments, LG Display regained the top spot with shipments of 8.3 million square meters, followed closely by BOE at 8.1, with Innolux and CSOT not far behind.
Display Area Prices by Panel Maker, Q3 2018 to Q3 2020
Turning to company balance sheets, inventory remained restrained or even tight at the end of Q3; inventory value increased by a slight 1% Q/Q, but with the increase in shipments this reduced the inventory days from 40 to 35. Of the twelve companies reporting results, eleven showed a decrease in inventory days, with only LGD increasing.
The industry’s operating cash flow improved dramatically in Q3, increasing 139% Q/Q and 273% Y/Y to $3.4 billion, with all seven of the panel makers reporting cash flow in the positive column.
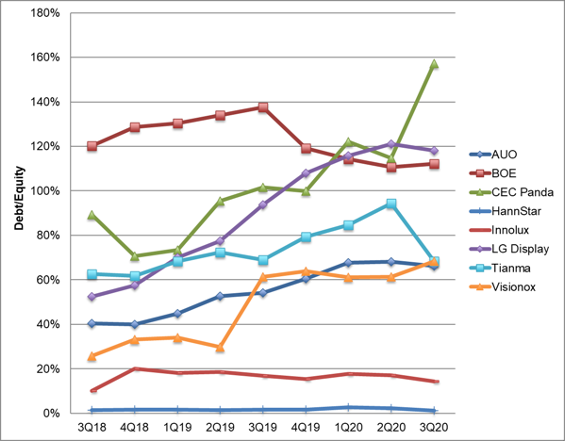
The large operating losses in the industry in 2019 and the first half of 2020, combined with continued investment in new capacity, have led to increased debt levels for most panel makers. The last chart here shows the debt/equity ratios of eight panel makers; this excludes JDI who reported negative equity in Q4 2019 and despite a cash infusion remains at 580% in Q3. The debt/equity ratios of BOE, LG Display, and CEC Panda now exceed 100%, but Innolux and HannStar remain at very low debt levels.
Panel Maker Debt to Equity, Q3 2018 to Q3 2020
The increase in demand for LCD TV panels, and the corresponding increase in panel prices, has lifted the fortunes of panel makers across the industry in Q3. These results are likely to get even better in the final quarter of the year.