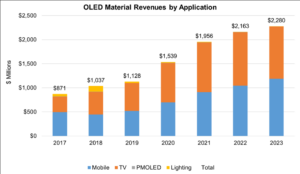
Sales for OLED stack materials for all applications are expected to grow at a 17% annual CAGR from $1.04 billion in 2018 to exceed $2 billion in 2022 and reach $2.28 billion in 2023, according to the latest update of DSCC’s Quarterly OLED Material Report, written in cooperation with the OLED Association.
The report details all aspects of OLED materials, including multiple applications, supplier matrices, and cost comparisons.
The report incorporates the latest update to DSCC’s capacity and utilization outlook for AMOLED, and to the OLED Association’s capacity outlook for PMOLED and OLED Lighting. As we have reported earlier this year, LG Display’s exit from the OLED Lighting business has dramatically reduced the prospects for that application, and Pioneer’s exit this year further reduces the prospects for OLED Lighting. Nevertheless the growth of AMOLED in TV and phones, as well as other applications, will continue to drive material sales.
OLED Material Revenues by Application, 2017-2023
Source: DSCC/OLED-A Quarterly OLED Material Report
The current update includes revised input area for AMOLED, with small changes in the anticipated utilized capacity for both small/medium OLED and OLED TV in 2019-2023. The current update also includes new input on material pricing and material UT%. Based on the new input of material UT% for open mask vacuum thermal evaporation (VTE), we have reduced the expected rate of improvement for material UT% for this process. Finally, the current update includes a new supplier matrix, based on new input from our contacts in Korea.
The report details the OLED stack configurations of all the major OLED product architectures, and this quarter we have revised our stack profiles for Small/Medium RGB OLED, for White OLED TV, and for quantum dot (QD) OLED.
Stack Profile, RGB OLED for Small/Medium Applications
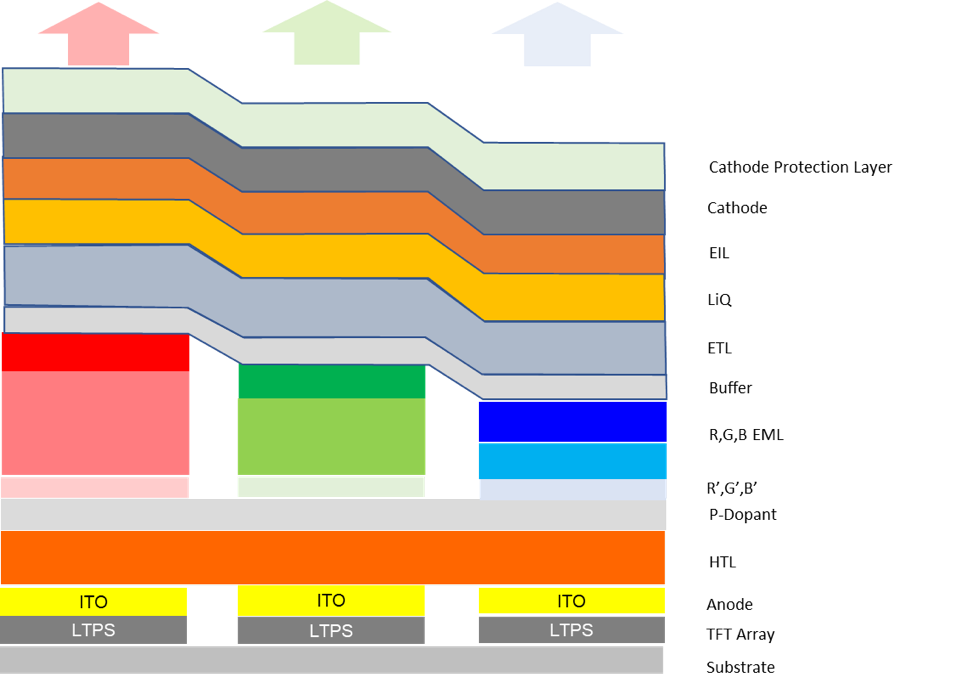
Source: DSCC/OLED-A Quarterly OLED Material Report
One of the biggest changes in the current update addresses the revenue of Novaled. Prior versions of this report greatly underestimated the revenues of Novaled. Although Novaled is not publicly traded, some financial information on their revenues is available via the SDI Consolidated Financial Statements, since SDI acquired a 50% stake in the company in 2015. Novaled revenues in 2017 and 2018 were KRW 107 billion and KRW 135 billion, respectively (US$95M, $122M), and we believe that 100% of these revenues were from OLED materials.
We have learned new information about the pricing of Novaled’s P-Dopant material and its contribution to the OLED stack, and that new information is included in the OLED Stack diagrams and the calculations from 2019 onward. As shown in the next chart, revenues from P-Dopant material (PDT in the chart) represent one of the largest portions of the OLED stack.
Material Revenues for RGB FMM S/M OLED by Layer Type, 2017-2023
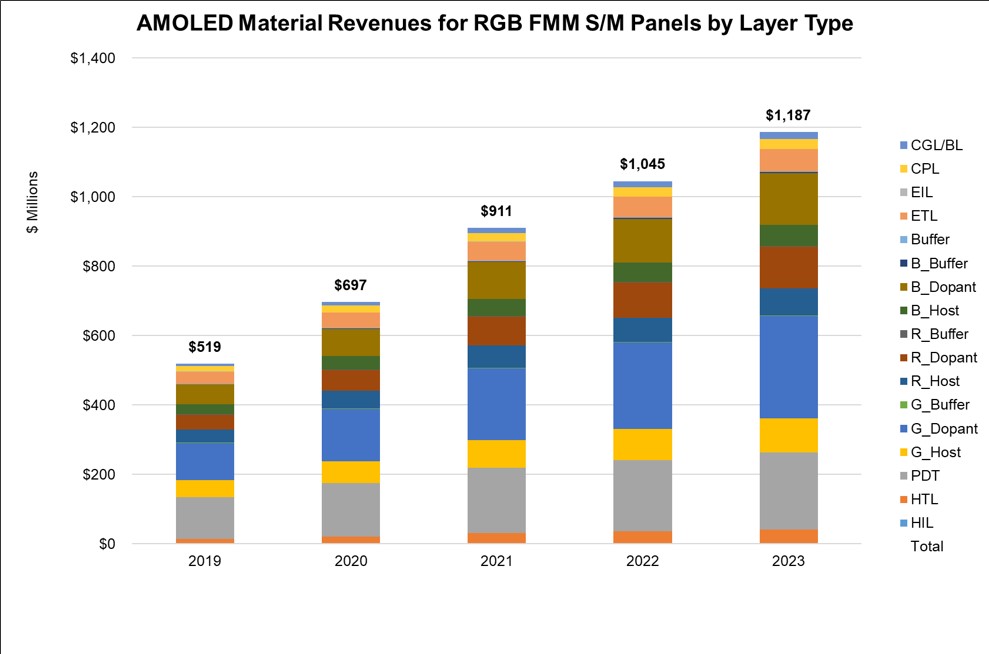
Source: DSCC/OLED-A Quarterly OLED Material Report
Our updated view of input area includes a reduced outlook for QD OLED, as we see Samsung implementing this technology at a delayed pace. However, we still expect that the OLED stack costs for QD OLED will be substantially lower than those for WOLED. WOLED unyielded material stack costs will be continuously improving, from an estimated $97.79 per square meter in 2019 to $55.22 per m2 in 2023, but from the time that QD OLED is introduced, its unyielded stack costs are expected to be only a little more than half as much. Of course, that’s only a part of the picture, because the yields on the mature WOLED technology will certainly be higher than those for QD OLED in its initial stages, and even more important, the color converter in QD OLED will be substantially more expensive than the color filter used in WOLED.
?While inkjet printing with soluble OLED materials promises improvements in both performance and cost, we do not expect that soluble materials will be widely used until the later years of our forecast time frame, as almost all of the recent and upcoming investment in OLED has been for evaporative deposition, as shown in the next chart. Whether via fine metal mask for small/medium displays or via open mask for TV sizes, evaporative OLED materials will continue to dominate the market.
Material Revenues by Deposition Type, 2017-2023

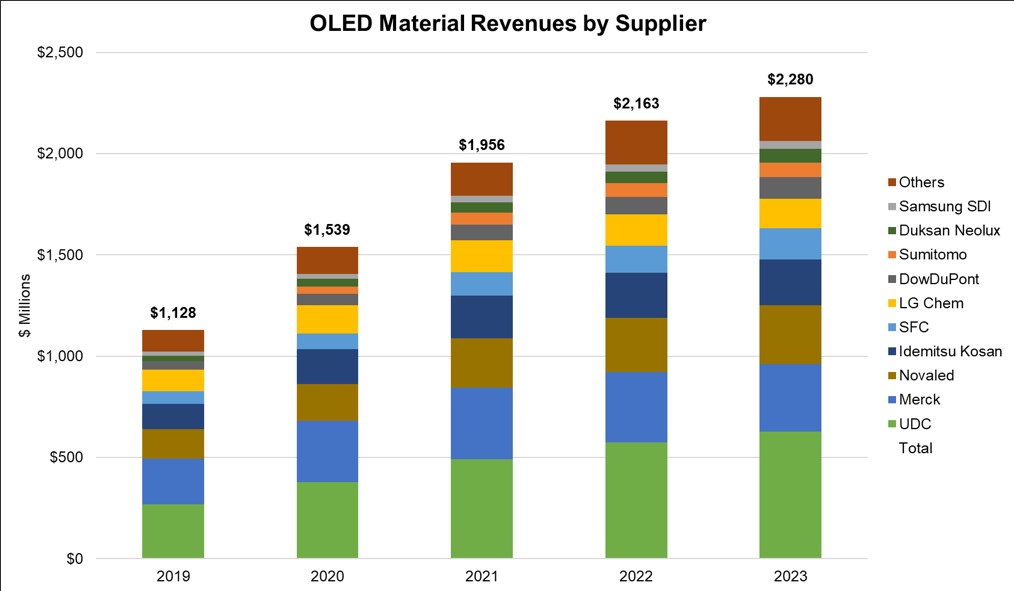
Based on the existing supplier matrix, the report includes a projection of OLED material revenues by supplier, as shown in the next chart. Universal Display Corporation (UDC) has been the #1 supplier in revenues for the industry, and we expect that to continue. Merck holds the number two position in the supplier rankings, and Novaled takes third place. These three companies are expected to capture 56% of industry revenues in 2023, but as the chart indicates there is a long tail of companies supplying materials into the industry.
The DSCC/OLED-A Quarterly OLED Material Report includes profiles for all major OLED stack architectures, and covers active matrix OLED (AMOLED) for displays, plus passive-matrix OLED for smaller displays and OLED for Lighting applications. Supplier matrices for the main OLED panel makers allow for revenue projections for 20 material suppliers. For more information about the report, please contact Gerry McGinley at 770-503-6318, e-mail [email protected], or contact your regional DSCC office in China, Japan or Korea.