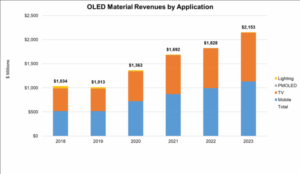
Sales for OLED stack materials for all applications are expected to grow at a 16% annual CAGR from $1.03 billion in 2018 to $2.15 billion in 2023, according to the latest update of DSCC’s Quarterly OLED Material Report, written in cooperation with the OLED Association. The report details all aspects of OLED materials, including multiple applications, supplier matrices, and cost comparisons.
The report incorporates the latest update to DSCC’s capacity and utilization outlook for AMOLED, and to the OLED Association’s capacity outlook for PMOLED and OLED Lighting. As we reported last year, LG Display’s exit from the OLED Lighting business reduced dramatically the prospects for that application. Nevertheless the growth of AMOLED in TV and phones, as well as other applications, will continue to drive material sales.
OLED Material Revenues by Application, 2018-2023
Source: DSCC/OLED-A Quarterly OLED Material Report
The current update includes revised input area for AMOLED, with reductions in OLED TV input area based on delayed ramps by LGD in 2019-2023 and removal of BOE’s Gen 10.5 from our calculations (we now see a BOE expansion for OLED as lower probability within this timeframe). This update also includes small changes in the anticipated utilized capacity for mobile OLED, PMOLED and OLED Lighting. The Powerpoint of the report includes new information on OLED Material Technology reported at recent conferences.
The report details the OLED stack configurations of all the major OLED product architectures, such as the profile for quantum dot (QD) OLED, shown here.
Stack Profile, QD OLED
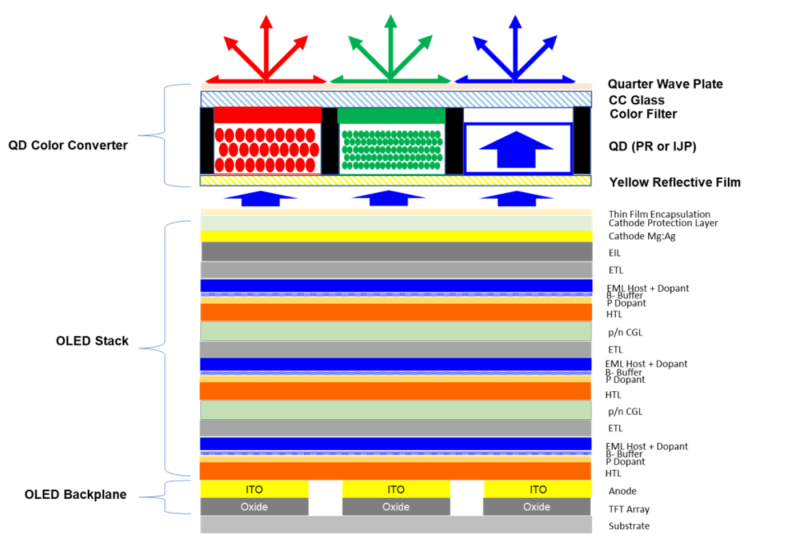 Source: DSCC/OLED-A Quarterly OLED Material Report
The stack profile, along with estimates of material thickness, material utilization, and material prices, form a picture of the unyielded stack cost for each OLED product architecture; the stack cost for WOLED is shown in the next chart. Based on steady, incremental improvements in material utilization and material price reductions, we expect that unyielded stack costs per square meter for WOLED will decline from $97.69 in 2019 to $61.59 in 2023, which will be a meaningful contributor to cost reduction required for LGD to keep OLED TV competitive with aggressively priced LCD TV. For LGD the yielded cost is more important, and yield improvements at both its Korea and China fabs will be critical to bringing panel costs down.
Unyielded OLED Stack Material Cost per Square Meter, 2018-2023
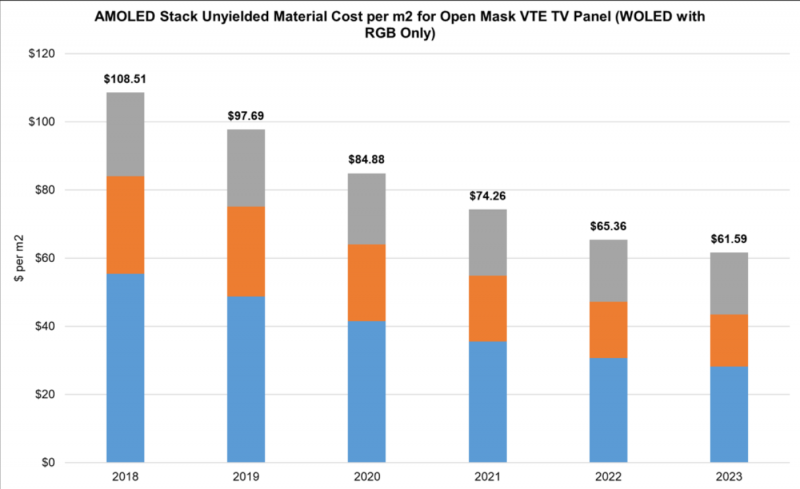 Source: DSCC/OLED-A Quarterly OLED Material Report
We expect that the OLED stack costs for QD OLED will be substantially lower than those for WOLED. When QD OLED is introduced, its unyielded stack costs are expected to be 30-40% lower. Of course, that’s only a part of the picture, because the yields on the mature WOLED technology will certainly be higher than those for QD OLED in its initial stages, and the color converter in QD OLED will be substantially more expensive than the color filter used in WOLED. While we expect the OLED stack cost of QD OLED to be lower than that of WOLED, we expect the total product cost of QD OLED to be higher.
While inkjet printing with soluble OLED materials promises improvements in both performance and cost, and we will see the first mass production of inkjet printed OLEDs in 2020 with JOLED’s expansion, we do not expect that soluble materials will be widely used until the later years of our forecast time frame, as shown in the next chart, since almost all of the recent and upcoming investment in OLED has been for evaporative deposition. Whether via fine metal mask for small/medium displays or via open mask for TV sizes, evaporative OLED materials will continue to dominate the market.
Material Revenues by Deposition Type, 2018-2023
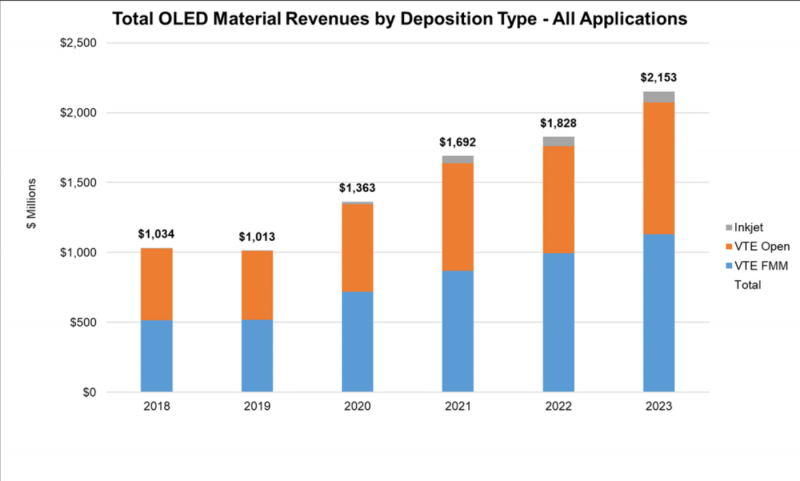 Source: DSCC/OLED-A Quarterly OLED Material Report
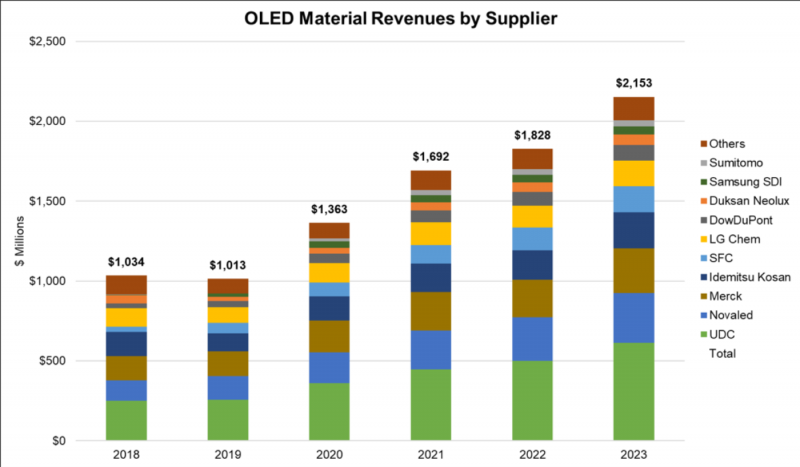
Based on the existing supplier matrix, the report includes a projection of OLED material revenues by supplier, as shown in the next chart. Universal Display Corporation (UDC) has been the #1 supplier in revenues for the industry, and we expect that to continue. Merck holds the number two position in the supplier rankings, and Novaled takes third place. These three companies are expected to capture 56% of industry revenues in 2023, but as the chart indicates there is a long tail of companies supplying materials into the industry.
The methodology applied in the OLED Material report generates an estimate of “revenues of OLED materials consumed by panel makers”, which can be somewhat different than “revenues of OLED materials purchased by panel makers”. While over the long term these two will be the same, in any specific time period there can be build-ups or drawdowns of material inventory by panel makers that will cause difference.
OLED Materials Revenues by Supplier, 2018 – 2023
 Source: DSCC/OLED-A Quarterly OLED Material Report
The DSCC/OLED-A Quarterly OLED Material Report includes profiles for all major OLED stack architectures, and covers active matrix OLED (AMOLED) for displays, plus passive-matrix OLED for smaller displays and OLED for Lighting applications. Supplier matrices for the main OLED panel makers allow for revenue projections for 20 material suppliers. For more information about the report, please contact Gerry McGinley at 770-503-6318, e-mail [email protected], or contact your regional DSCC office in China, Japan or Korea.