DSCC has updated its display capacity forecast as part of its Quarterly Display Capex and Equipment Market Share Report.
There were a number of interesting findings such as:
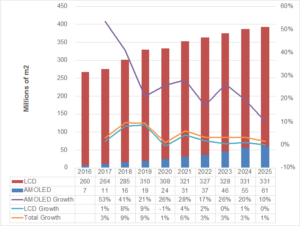
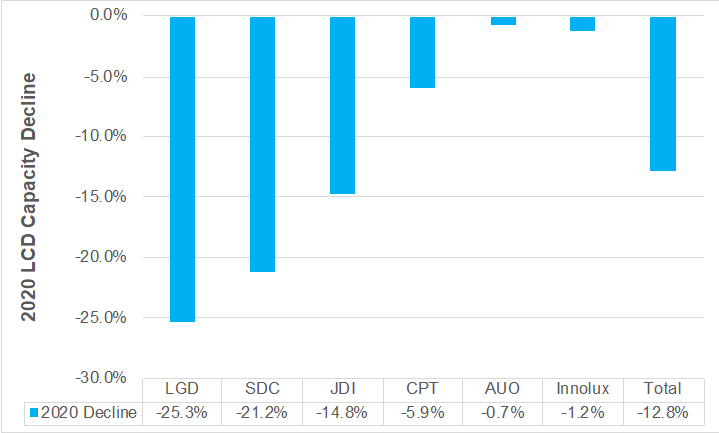
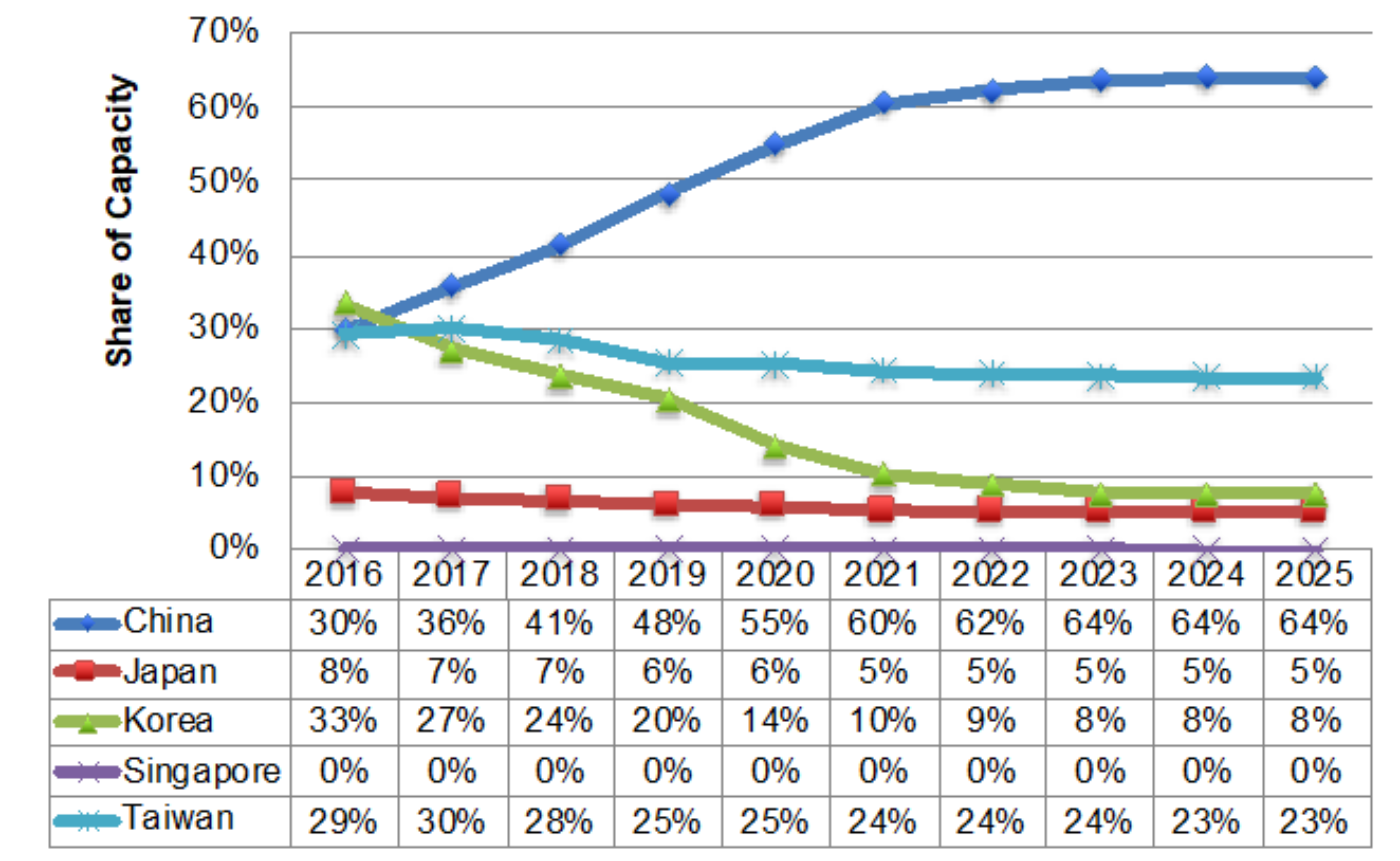
- Capacity is only expected to grow 1% in 2020 with LCD capacity down 1% and OLED capacity up 26%. This is the first capacity decline we are aware of in the history of the LCD industry. We show LCD capacity shrinking at 6 companies in 2020 due the challenges associated with competing against subsidized Chinese competition resulting in financial challenges, fab closures, downsizing/right sizing and conversions to OLEDs where Chinese companies are not as strong. In addition, China’s LCD capacity is growing more slowly than expected in 2020 due to market conditions and the coronavirus leading to downsizing and delays in installations and fab ramps. The 6 companies seeing declines bring capacity down by 21.3M square meters or 7% of total 2020 LCD capacity and their combined capacity is down 13%. How will the slow LCD capacity growth impact the market? We have already seen prices rise significantly, but demand may also decline in 2020 due to the coronavirus which should reduce the impact of the capacity decline. We show AUO reducing a small amount of G5/G6 capacity and Innolux reducing a small amount of G5 and G5.5 capacity in 2020 on shifts to IPS in IT panels. CPT and JDI have had financial problems while LGD and SDC are shifting their focus to OLED where they are better positioned than their Chinese competitors. Looking forward, while we don’t show additional capacity declines at AUO, CPT, Innolux or JDI in 2021 or beyond, we show continued LCD declines in Korea at SDC and LGD with their combined LCD capacity shrinking 46% between 2020 and 2025. But the bigger story is in Korea where their share of LCD capacity is expected to shrink from 20% in 2019 to just 8% in 2025 and LCD capacity is expected to be flat from 2023 – 2025. As a result, China’s share now rises to an astonishing 64% of the LCD market in 2025.
2016 – 2025 Display Capacity and Growth
LCD Capacity Declines in 2020 by Company
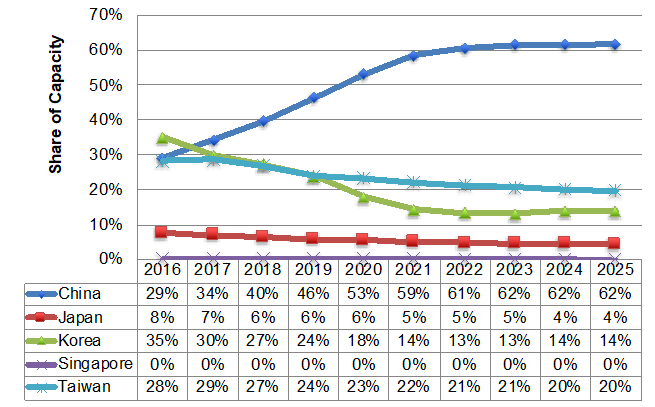
LCD Capacity Share by Country
- On the other hand, we did raise our overall display capacity forecast by 3.5% in 2025 vs. our previous issue on one new LCD fab, HKC H5, one new OLED fab, CSOT T9, and a number of accelerated and larger OLED investments. LCD capacity is now 2.4% larger in 2025 than previous, while OLED capacity is 10% larger than previous as OLED TV capacity growth picks up. OLEDs now grow at a combined 21% CAGR from 2019 to 2025 to reach a 16% share of total display capacity with LCDs rising at a 1.1% capacity and falling to an 84% share.
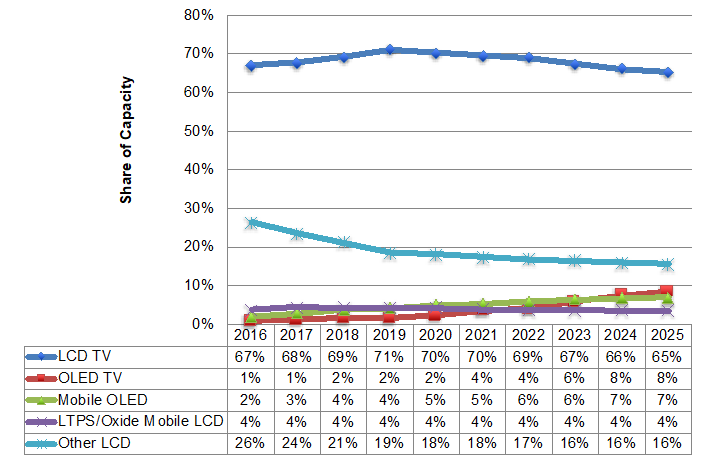
- In terms of capacity share and growth by application, we show:
- LCD TVs will continue to dominate capacity and are still growing, rising at a 1.5% CAGR but losing share from 71% in 2019 to 65% in 2025.
- OLED TVs are expected to enjoy the fastest growth, rising at a 36% CAGR with its share rising from 2% in 2019 to 8% in 2025.
- Mobile OLEDs are expected to grow at a 12% CAGR and reach a 7% share, up from 4% in 2019.
- Mobile LCDs are expected to fall at a 0.5% CAGR and maintain a 4% share.
Capacity Share by Application
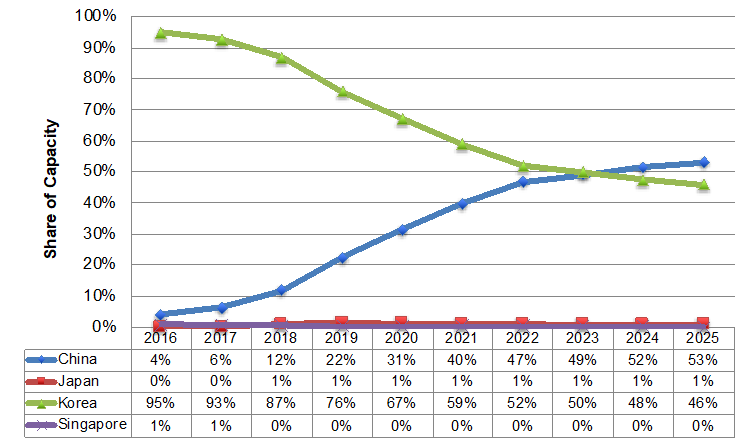
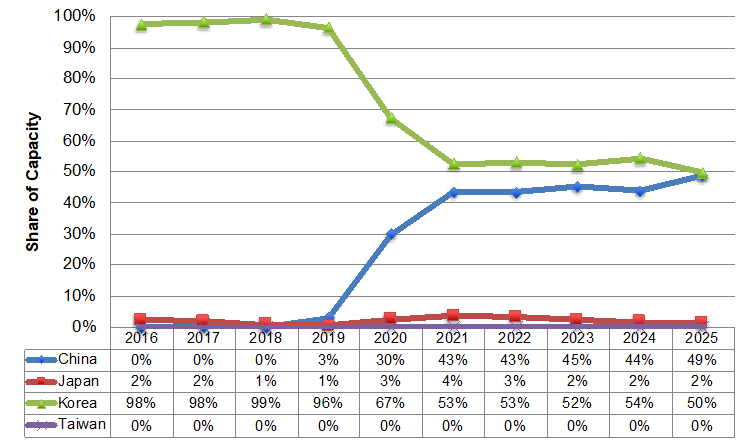
- China’s share of total display capacity is expected to rise at an 8% CAGR from 2019 to 2025 to reach a 62% share with Korea’s falling at a 6% CAGR and dropping to a 14% share. In OLEDs, China is now forecasted to overtake Korea in unyielded OLED capacity in 2025 rising at a 45% CAGR vs. Korea at 21%. Thus, by 2025, Korea will lead in capacity in both OLEDs and LCDs. In mobile OLEDs, China is expected to overtake Korea one year earlier, in 2024 and lead in 2025 with a 53% to 46% advantage. Only in OLED TVs is Korea expected to maintain advantage by 2025 on an unyielded basis with a slight 50% to 49% advantage. For yielded capacity comparisons, please see our Quarterly OLED Supply/Demand and Capital Spending Report.
Total Display Capacity by Country
OLED Capacity by Country
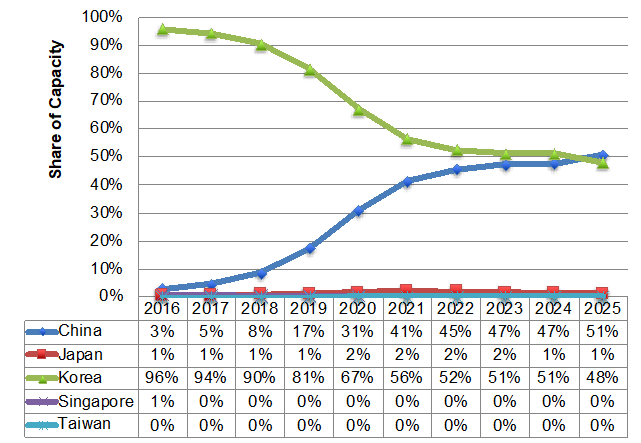
Mobile OLED Capacity by Country
OLED TV/IT/Auto Capacity Share by Country
- By manufacturer
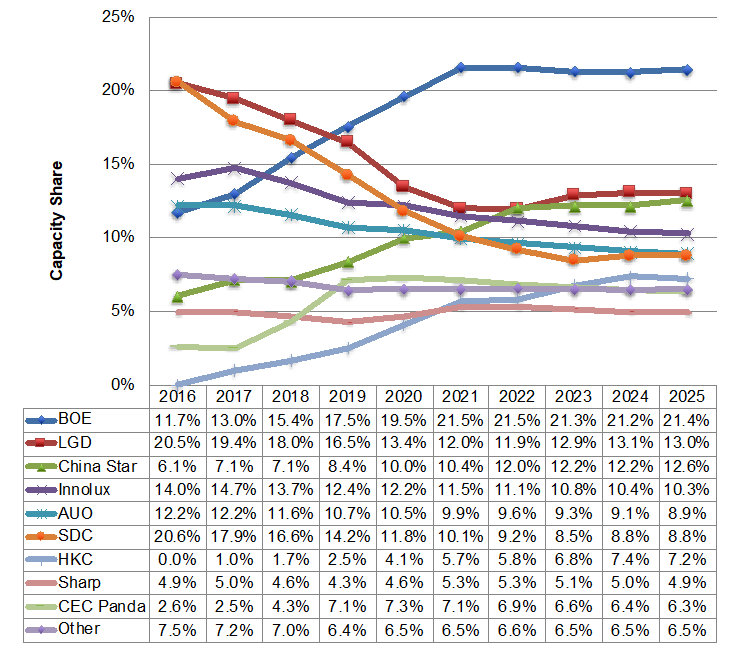
- BOE’s share of capacity is expected to rise from 17.5% in 2019 to 21.4% in 2025 on a 6% CAGR.
- LGD is expected to remain #2 with China Star, Innolux, AUO, SDC and HKC to round out the top 6.
- SDC leads in total OLED capacity from 2016-2020 and is expected to be overtaken by LGD in 2021.
- In mobile OLEDs, Samsung will maintain a dominant position throughout the forecast, with its share not falling below 50% until 2022 and only falling to 41% in 2025. BOE is expected to overtake LGD in 2020 for #2 on a 31% CAGR.
- In flexible mobile OLED capacity, SDC’s share falls from 60% in 2019 to 32% in 2025 on a 5% CAGR. BOE’s share surges from 14% in 2019 to 30% in 2024.
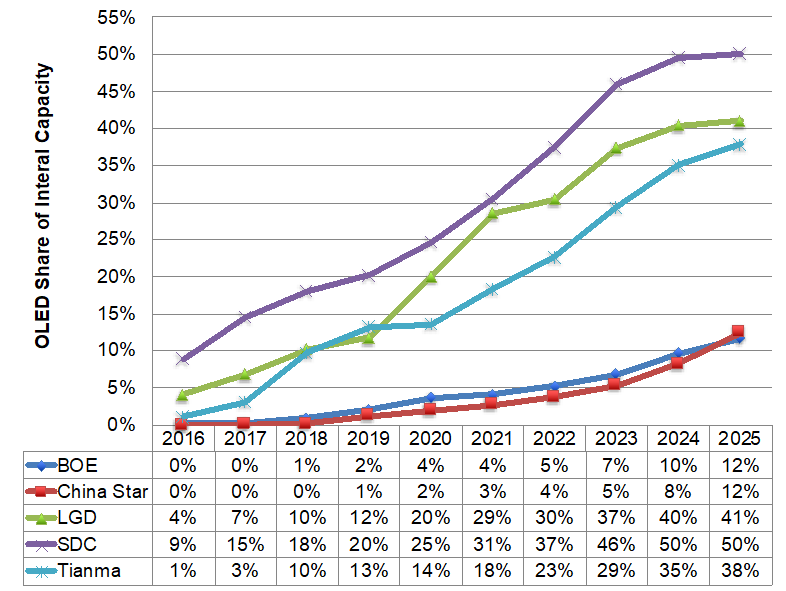
- SDC’s capacity will be 50% OLED from 2024 with LGD and Tianma expected to reach 41% and 38% respectively in 2025. China Star and BOE will get into double-digits in OLED capacity share from 2024-2025.
Display Capacity by Manufacturer
OLED’s Share of Each Company’s Capacity
For fab by fab capacity, equipment spending and equipment market share broken out by frontplane, backplane, glass size, application, country, manufacturer, supplier, etc., in an easy to use pivot table and insightful PDF report, please see our Quarterly Display Capex and Equipment Market Share Report.