In consideration of the dramatic worldwide economic downturn resulting from the COVID-19 pandemic, DSCC has revised its outlook for demand for major display devices; we now expect Y/Y declines in all major display applications and declines in area and revenue for the display industry.
As events are moving quickly, it’s important for our readers to recognize that our forecast update reflects the perspective as of March 25th, 2020. For the purpose of this article, we will refer to our view as the “March 2020 forecast” and distinguish it from our original forecast for the year, the “January 2020 forecast”. As you will see, we expect a substantial downturn in the first two quarters of the year, with a gradual recovery in the second half, with TV volumes (as one example) in Q4 reaching and exceeding the January 2020 forecast levels.
We are not including any update for 2021 or afterward; our first thoughts are that demand will return to “normal” and therefore 2021 – 2025 would be unchanged. However, if the COVID-19 crisis gets more severe, the impact is likely to extend into the second half of 2020 and into 2021.
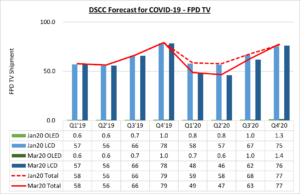
We’ll start with our update for TV, since TV accounts for more than 70% of display area. Our view of TV set shipment volume by quarter for 2019-2020 is shown in the first chart here. In our January outlook, we expected that total TV shipment volume for the year would be up 0.4% from 259.6 million to 260.7 million, with LCD volumes flat at 256.6 million and OLED TV volumes increasing from 2.9 million to 4.1 million. Based on a typical seasonal pattern, we expected the 1stquarter to show a Q/Q decline of 26%, and a 1H/2H seasonality of 45/55.
DSCC Quarterly TV Shipment Forecast Revised for COVID-19 Impact
Based on the reduced demand in China, the US, Europe and worldwide, we now expect that Q1 volume will show a 38% Q/Q decline, and volumes will decline another 4% Q/Q in Q2 before starting to recover in Q3. The seasonality pattern for 1H/2H in our March 2020 outlook is 41/59. Our March forecast for Q4 2020 is slightly higher than our January forecast for Q4 2020, reflecting pent-up demand.
Overall for full year 2020, we now expect a 9% decline Y/Y in TV shipment volume, to 236 million, with a 10% decline in LCD TV volume to 232 million and a 27% increase in OLED TV volume to 3.8 million.
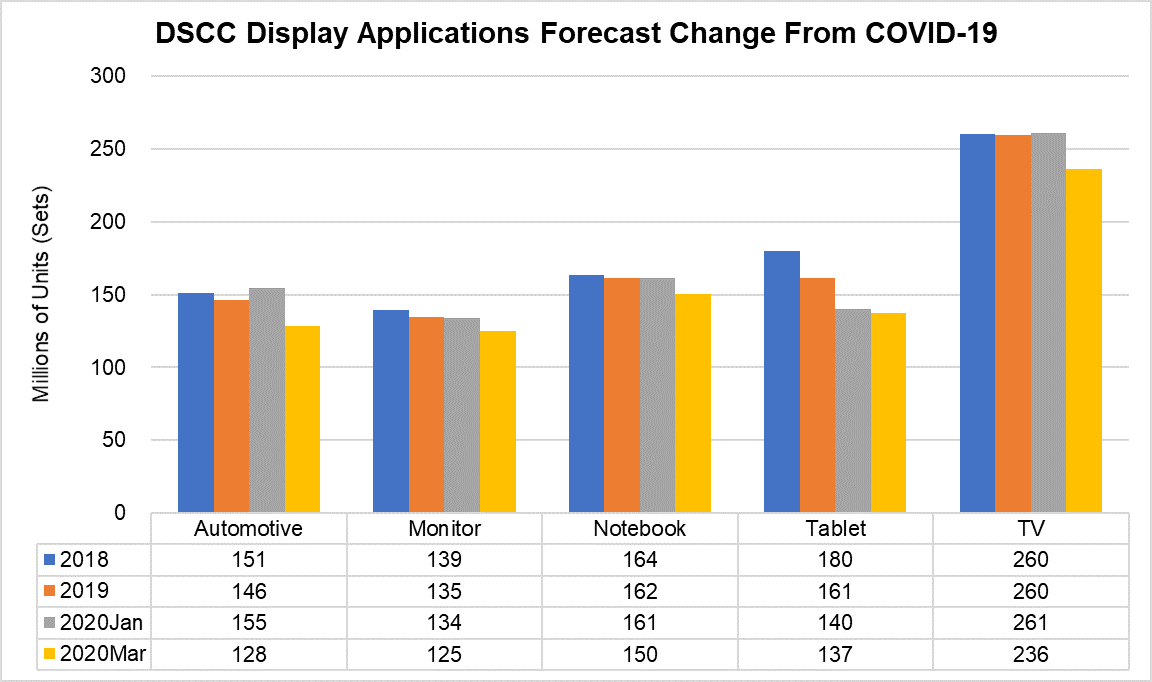
For phones (including featurephones), in our January outlook we expected a 2.7% unit increase, based on replacement demand stimulated by new 5G products. We are now expecting a 10% decline in handset volume, from 1.84 billion in 2019 to 1.66 billion in 2020 which would worsen if Apple delays its new smartphone launch in September as was rumored last week. Our revision for other major display applications is shown in the next chart here (at the device or set level).
For all of these mature technologies, our January forecast predicted flat or declining volumes, with the exception of automotive displays (which includes all types, center console + instrument cluster + others) where we expected a 6% increase Y/Y. We now expect automotive to be the hardest hit, with a 12% Y/Y decline to 128 million units, as consumers avoid big-ticket purchases. Automotive production has been shut down in the US and Europe, and automotive demand will likely recover only slowly. We now expect monitor and notebook demand to decline by 7% each, and we expect tablet demand to decline by 15%.
Based on the revised outlook for devices, we have revised our forecast for display panels. As a rule, there are roughly 1.1 display panels per each device, though this varies somewhat by application and product segment. Rather than giving all the details on panel updates, we can simply say that our panel forecast follows directly from our device forecast.
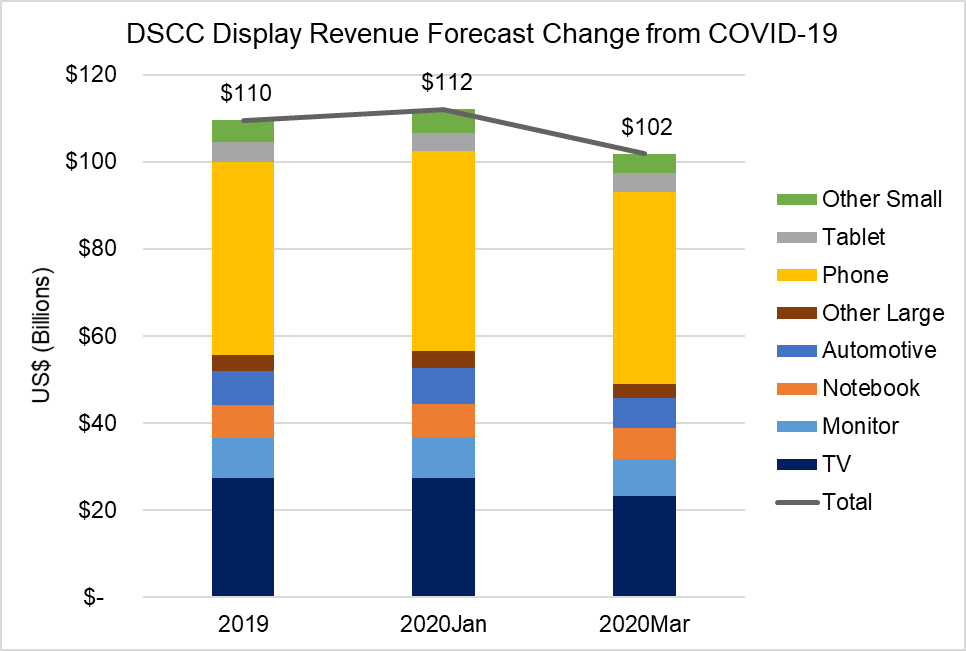
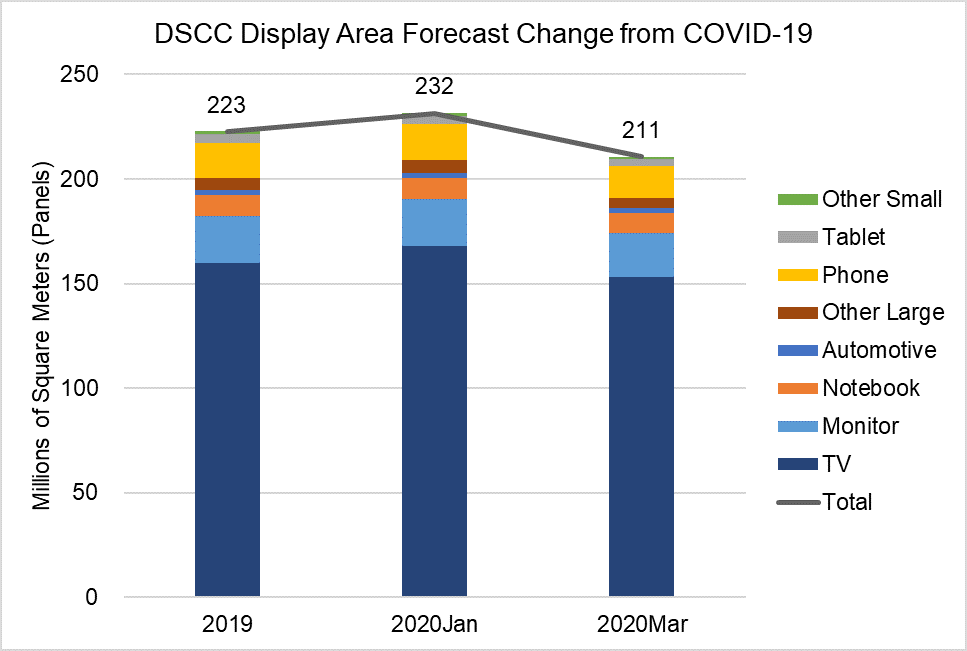
With the panel forecast, though, we generate an overall picture of display demand by area and display revenues, as shown in the next two charts. As the charts indicate, display area is dominated by TV, which made up 72% of display area in 2019, but the largest revenues come from smartphone panels, which generated 40% of display revenue compared to only 25% for TV in 2019. We did not expect any dramatic shifts in area share or revenue share by application in our forecast, but screen size growth will push the area share for TV slightly higher, and that does not change with the revision.
Before the impact of COVID-19, we were expecting a 4% increase Y/Y in display area, but with the revised forecast we now expect a 5% decline, with declines across all applications. With respect to display technology, we are still expecting growth in OLED display area of 33% from 8.0 million to 10.7 million square meters, though the 2020 estimate is down from the prior forecast of 11.2 million square meters. For LCD, whereas in January 2020 we were expecting 3% area growth for the year from 223 million to 232 million square meters, in our March 2020 update we now are forecasting a 7% Y/Y decline to 200 million square meters.
For display revenues, before the impact of COVID-19, we were expecting a 2% increase Y/Y, but with the revised forecast we now expect a 7% decline, with declines across all applications except smartphone, where we expect revenues to be flat at $44.2 billion. With respect to display technology, we are still expecting growth in OLED display revenues of 21% from $28 billion to $33.7 billion, though the 2020 estimate is down from the prior forecast of $34.3 billion. For LCD, whereas in January 2020 we were expecting a 5% revenue decline for the year from $82 billion to $78 billion, in our March 2020 update we now are forecasting a 17% Y/Y decline to $68 billion.
As noted above, this forecast reflects our view in late March in a very dynamic market, and developments in the COVID-19 pandemic can alter the outlook substantially. If the spread of the virus persists, our estimates of volume for the first half are not likely to change much, but our forecast for a 2nd half recovery are at risk.