Strong LCD panel demand from the work-from-home and education markets, steady LCD TV demand along with declining LCD panel capacity in Korea as the result of excessive losses from government subsidized Chinese competition has led to tight supply, higher LCD prices, consolidation in China, a return to profitability for most LCD suppliers and now rising future LCD capex.
In DSCC’s latest Quarterly Display Capex and Equipment Market Share Report, LCD equipment spending was upgraded by 37% on a move-in basis for 2021 as the result of three recently announced smaller expansions along with additional spending being pulled in from 2022. From 2020-2022, LCD equipment spending has been upgraded by 3% to $13.4B.
At the same time, OLED capacity spending is also on the rise due to its bright outlook and is more beneficial to equipment suppliers due to its higher capital intensity relative to LCDs. With LG Display boosting mobile OLED capacity in response to tight supply resulting from increased allocation on the Apple iPhone 12, China Star boosting its commitment to OLED TVs/IT/automotive panels through its announced $6.8B RGB IJP fab projects and Visionox and EDO pulling in new mobile fabs as they look to take more share , 2020-2023 OLED equipment spending was increased by 11% to $45B.
In total for both LCDs and OLEDs, display equipment spending for 2020-2023 was upgraded by 9% vs. our last issue to $51B. By year:
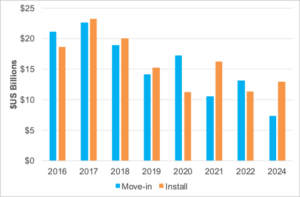
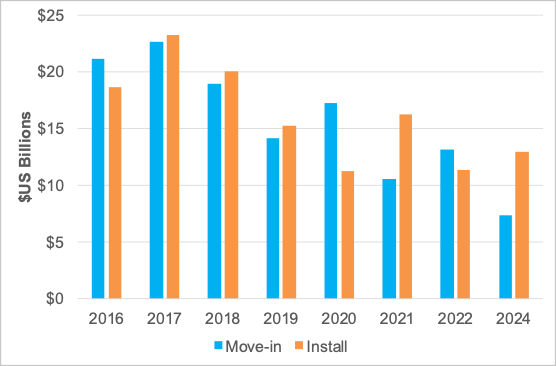
- 2021 was upgraded by 20% on a move-in basis to $10.6B and 24% on an install basis to $16.2B with the large difference between move-in and install the result of the additional time required to install tools due to COVID-19 travel and work restrictions. On a move-in basis, OLEDs are expected to hold a 52%/48% advantage over LCDs with mobile holding a 52%/48% advantage over TVs.
- 2022 move-in spending was revised up by 11% to $13.2B which is up 24% Y/Y. OLED spending is expected to rise 101% with LCD spending down 61% with the OLED share rising to 85%. TVs to hold a 51%-49% advantage.
- 2023 move-in spending was upgraded 9% on increased RGB IJP OLED fab spending by China Star. Overall, we show a 10% decline in OLED spending and no LCD spending. Mobile should account for a 55% share of spending.
2016-2024 Display Equipment Spending
Other interesting takeaways include:
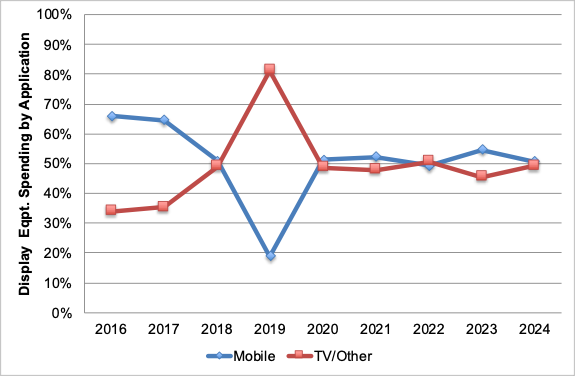
- From 2020 – 2024, spending by application is expected to be extremely balanced between mobile and TV at 51%/49% in favor of mobile. This is largely a result of the rising capital intensity of OLED TV investments.
- China is expected to dominate 2020-2024 spending with an 81% share with a 100% share in LCDs and a 75% share in OLEDs. Korea is expected to account for a 19% share of display spending and a 25% share in OLEDs. Of note, we are increasingly hearing about potential display manufacturing projects in India although it could be with used equipment.
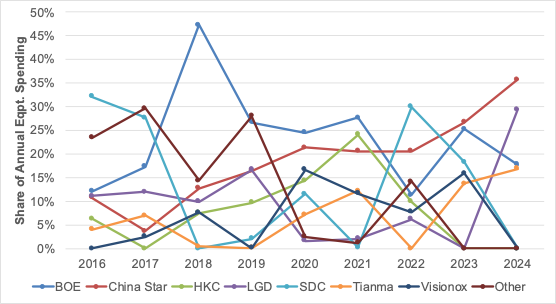
- For the first time, we show China Star out-spending BOE as a result of its mobile OLED, G10.5 LCD and OLED TV investments. China Star will have a 24% to 21% advantage over BOE in new equipment spending from 2020-2024. BOE will still have a healthy capacity lead as a result of acquiring CEC Panda assets. China Star is expected to have the highest equipment spending share in OLEDs at 23% to vs. BOE at 22% with HKC leading in LCD equipment spending with a 47% share followed by China Star at 25% and BOE at 18%.
2016-2024 Display Equipment Spending by Application (Move-in Basis)
2016-2024 Display Equipment Spending by Manufacturer (Move-in Basis)
Equipment spending in units and revenues is shown by frontplane technology, backplane technology, customer, country, substrate size, substrate type and quarter from Q1’16 – Q4’24 on a bookings, delivery and install basis for 175 different suppliers and 80 different equipment segments. Supplier market share is provided in units and revenues by technology from 2016-2024 for over 70 different segments. In the Q4’20 issue, lamination equipment market share was added with SFA the top supplier in 2020.