
During the final game of the 2018 World Cup, Conviva measured a massive 9.12 million peak concurrent plays (PCP), smashing previous records as more than 9 million people tuned in at once to see Croatia take on France. Previously, the record for peak concurrency was held by the 2018 Super Bowl, measured by Conviva at 5.5 million PCP.
That record was broken on day one of the World Cup, with 6.33 million PCP. During the 30-day tournament, there were 22 days where PCP exceeded the pre-World Cup record and, by the final game, Conviva measured traffic which set new PCP records five times over.
The 9.12 million PCP of the final match dwarfs the previous World Cup peak of 3.29 million that Conviva measured in 2014, as well as the 1.5 million measured in 2010, which marked the first time a streaming event secured a broadcast TV-level audience.
This impressive growth is a clear indicator of the adoption of streaming TV and the confidence of consumers to choose streaming to ensure they don’t miss the winning goal, no matter where they may be watching. Given the increase in traffic from 2014 to 2018, if growth continues on the same trajectory, there is a possibility of 25 million or more peak concurrent plays during World Cup 2022, analysts say.
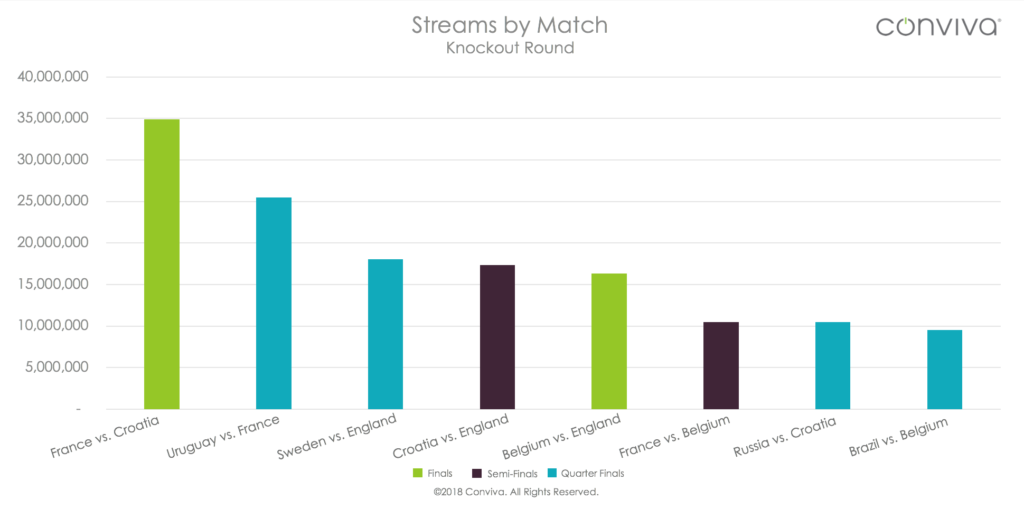
The final game of the World Cup was also the single-most streamed game of the knockout round, with 41.2 million attempts, resulting in 34.9 million plays. This single game saw more than the two semi-final games combined — Conviva measured 32.4 million attempts, resulting in 27.9 million successful plays. As Belgium and England vied for third place, Conviva measured 20.1 million attempts, resulting in 16.3 million plays, solidly in the middle of the pack between the quarter and semi-final matches.
While total viewership was off the charts, the final two games of the World Cup saw lower engagement on average than other matches of the knock-out phase, with 54.9 minutes of viewing time per unique viewer, compared to 83.8 minutes in the semi-finals and 64.6 minutes in the quarter finals. The drop is likely attributable to more casual fans checking in on the game, rather than sitting down to watch a full match.
Despite this, the final game amounted to nearly 10 million viewing hours, which was more than double the third-place match, which saw 4.4 million viewing hours.
Live sports continues to be the ultimate test for the impact of quality on viewing, as many points along the delivery chain are pushed to their limits. For the final two World Cup games, buffering was higher than average at 1.9%, compared to a rebuffering ratio of 1.6% measured in the semi-final games and 1.8% in the quarter-finals.
The lowest buffering Conviva measured was on Xbox, PlayStation, Apple TV, Chromecast and Fire TV devices, at around 0.3% rebuffering or less, while the worst buffering was found on Android devices at 2.82% on average.
In the final two games, 2.8 million additional viewing hours could have been possible if not for 10 million plays lost due to exits before videos could start, which Conviva measured at 12.81%, and videos failing to start, measured at 3.03%.
Analyst Comment
I was in rural France and had to rely on a stream as the DTT signal was very intermittent! Fortunately, just a few days before, Sky decided to allow paying subscribers to access their Sky Go streaming service even when in another country – I have long complained that this was not allowed before. (BR)