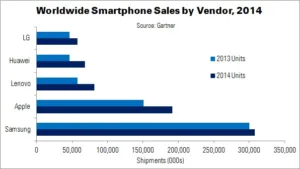
Worldwide smartphone sales reached 367.5 million units in Q4’14, rising almost 30% YoY. Gartner’s data shows that Apple displaced Samsung as the market leader – a spot that the Korean company has held since 2011! In 2014 overall, smartphone sales exceeded 1.2 billion units, up 28.4% YoY and representing 66% of global mobile phone sales.
Samsung’s market share declined almost 10 percentage points in Q4’14. The company’s share has been falling since its peak in Q3’13. Roberta Cozza, research director at Gartner, said that Samsung should use a “solid ecosystem” of apps, content and proprietary services to secure long-term loyalty and differentiation in the premium end.
| Worldwide Smartphone Sales to End Users by Vendor in 2014 (000s) | ||||
|---|---|---|---|---|
| Vendor | 2014 Units | 2013 Units | 2014 Market Share | 2013 Market Share |
| Samsung | 307,597 | 299,795 | 24.7% | 30.9% |
| Apple | 191,426 | 150,786 | 15.4% | 15.5% |
| Lenovo | 81,416 | 57,424 | 6.5% | 5.9% |
| Huawei | 68,018 | 46,609 | 5.5% | 4.8% |
| LG | 57,661 | 46,432 | 4.6% | 4.8% |
| Others | 538,710 | 368,675 | 43.3% | 28% |
| Total | 1,244,890 | 969,721 | 100% | 100% |
| Source: Gartner | ||||
Q4’14 was Apple’s best-ever quarter, selling 74.8 million units. Demand for iPhone 6 models was extremely high in the USA and China (up 88% and 56%, respectively).
Lenovo (results include Motorola sales) moved to third place, with a 6.6% market share (up 47.6%). Sales in Lenovo’s home market, China, were up 7.8% in Q4; the company also showed strong results in Russia, India, Indonesia and Brazil, with total worldwide sales rising 26% YoY.
Other Chinese vendors, such as Huawei and Xiaomi, continued to improve their domestic and overseas sales, especially in the low- and mid-range markets. “Chinese vendors are no longer followers”, said Cozza. “They are producing higher quality devices with appealing new hardware features that can rival the more established players in the mobile phone market. Brand building and marketing will be key activities in deciding which Chinese vendors can secure a foothold in mature markets”.
| Worldwide Smartphone Sales to End Users by Vendor in Q4’14 (000s) | ||||
|---|---|---|---|---|
| Vendor | 2014 Units | 2013 Units | 2014 Market Share | 2013 Market Share |
| Apple | 74,832 | 50,224 | 20.4% | 17.8% |
| Samsung | 73,032 | 83,317 | 19.9% | 29.5% |
| Lenovo | 24,300 | 16,465 | 6.6% | 5.8% |
| Huawei | 21,038 | 16,057 | 5.7% | 5.7% |
| Xiaomi | 18,582 | 5,598 | 5.1% | 2% |
| Others | 155,701.6 | 111,204.3 | 42.4% | 39.3% |
| Total | 367,484.5 | 282,866.2 | 100% | 100% |
| Source: Gartner | ||||
Low-cost availability accelerated users’ migration from feature phones to smartphones, pushing the smartphone OS market to double-digit growth in most emerging countries. Android particularly benefited from this, with market share increasing 2.2 percentage points (34%). Smaller players drove growth. Windows Phone’s performance was flat, but the OS had strong results in some European markets – especially in enterprise.
| Worldwide Smartphone Sales to End Users by Operating System in 2014 (000s) | ||||
|---|---|---|---|---|
| Operating System | 2014 Units | 2013 Units | 2014 Market Share | 2013 Market Share |
| Android | 1,004,675 | 761,288 | 80.7% | 78.5% |
| iOS | 191,426 | 150,786 | 15.4% | 15.5% |
| Windows | 35,133 | 30,714 | 2.8% | 3.2% |
| Blackberry | 7,911 | 18,606 | 0.6% | 1.9% |
| Other | 5,745 | 8,327 | 0.5% | 0.9% |
| Total | 1,244,890 | 969,721 | 100% | 100% |
| Source: Gartner | ||||
Total mobile phone sales to end users were almost 1.9 billion units: a 3.9% YoY rise. All regions recorded growth except Japan (down 2.8%) and Western Europe (down 9.1%).

