Since the release of the latest quarterly result data from Apple, the stock has fallen around $5 per share or about 4.5% in one day’s trading. Of course, this comes after an investors call on 7/21 when Apple presented the latest record numbers for the latest quarter. The second quarter of calendar year 2015 (which is Apple’s third quarter for the fiscal year 2015) ended with a total of 47.5 million iPhones sold versus analysts’ expectation of 49.4 million based on a poll by Fortune Magazine.
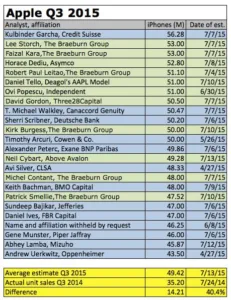
As a consequence, analysts see this as a shortfall of Apple in terms of market growth. In reality, the difference between the average expectation and the real number is 1.9 million units, of which 0.6 million were related to lowering channel inventory. For your entertainment, the following chart shows how the analysts’ estimates varied from 43.5 million at the low end all the way up to 56.3 million at the high end.
Source: Fortune Magazine
There was also the question raised about why the iPhone third quarter decline was worse than in former years. The following chart shows the development of unit sales over the last few years. From that chart, I would not see any difference in quarterly fluctuations of recent years. There is actually a remarkable consistency in the quarterly unit changes for the product categories in the Apple portfolio.
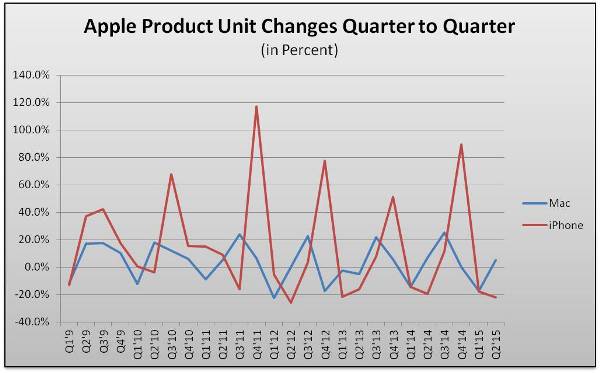
As one can see, technology leadership and market success are seen quite differently by technologists and stock analysts.
With a strong lead in the smartphone market, the key question was how well Apple did in the smartwatch market. Apple had already mentioned that it would not release any hard numbers of sales for the Apple Watch. Instead, the Watch numbers are incorporated into the ‘Other Product’ categories, where they share the spotlight with the iPod, Beats, and other accessories.
As Apple mentions, the iPod and accessories have been on a continuous decline for many quarters, a decline that continued during the last quarter. As a consequence, the difference in the other category underestimates the actual Apple Watch sales significantly. As Apple put it, more than 100% of the difference compared to the former quarter is attributed to the Apple Watch. Since Apple does not give out numbers (with the goal of keeping the competition in the dark), it is also difficult to say what the average sale price per watch is. With prices ranging from the $350 range all the way up to above $10,000 it is difficult to estimate any reasonable number.
With a difference in the other category of $800 to $900 million and a total value of $2.64 billion the real number is somewhere in between. With an assumed average sales price of $500 we are looking at anywhere from 1.6 million to 5.2 million (100% of the other category) watches. Canalys estimated a total of 4.2 million watches sold, which seems a tad high based on the just released numbers.
Of course, the investor call would have not been complete without a pep talk by Tim Cook about the development of a new segment and slow uptake in channel supply for the Watch. Of course, one may interpret this as a sign of disappointing sales for the Apple Watch in its first quarter. On the other hand, it may also indicate a great holiday season later this year with a more established supply chain, as the Watch faces its first Holiday season ever. Want to bet against it? – NH
Analyst Comment
Juniper put out an estimate of between 2 and 2.5 million Watches, based on the claim that sales were more than iPads or iPhones, which were about 2 million in the first 90 days or so. It sees the product as successful, but “running out of steam”. (BR)