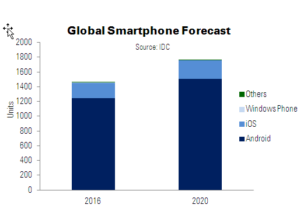
Worldwide smartphone shipments are expected to reach 1.46 billion units with a year-over-year growth rate of 1.6% in 2016 according to the latest forecast from IDC‘s Worldwide Quarterly Mobile Phone Tracker. Although growth remains positive, it is down significantly from the 10.4% growth in 2015. Much of the slowdown is attributed to the decline expected in developed regions in 2016, while emerging markets continue with positive growth. Developed markets as a whole (US, Canada, Japan, and Western Europe) are expected to see a compound annual growth rate (CAGR) of -0.2%, while emerging markets (Asia/Pacific excluding Japan, Central and Eastern Europe, MEA, and LatAm) will see a CAGR of 5.4% over the 2015-2020 forecast period.
“Growth in the smartphone market is quickly becoming reliant on replacing existing handsets rather than seeking new users,” said Jitesh Ubrani, senior research analyst with IDC’s Worldwide Quarterly Mobile Device Trackers. “From a technological standpoint, smartphone innovation seems to be in a lull as consumers are becoming increasingly comfortable with ‘good enough’ smartphones. However, with the launch of trade-in or buy-back programs from top vendors and telcos, the industry is aiming to spur early replacements and shorten lifecycles. Upcoming innovations in augmented and virtual reality (AR/VR) should also help stimulate upgrades in the next 12 to 18 months.”
Consumer preference for larger screens is expected to continue and the growing interest in AR/VR will only drive that forward as phablets (5.5″ and larger) go from roughly one quarter of the smartphone market to one third by 2020.
“As phablets gain in popularity, we expect to see a myriad of vendors further expanding their portfolio of large-screened devices but at more affordable price points compared to market leaders Samsung and Apple,” said Anthony Scarsella, research manager, Mobile Phones. “Over the past two years, high-priced flagship phablets from the likes of Apple, Samsung, and LG have set the bar for power, performance, and design within the ph
ablet category. Looking ahead, we anticipate many new ‘flagship type’ phablets to hit the market from both aspiring and traditional vendors that deliver similar features at considerably lower prices in both developed and emerging markets. ASPs for phablets are expected to reach $304 by 2020, down 27% from $419 in 2015, while regular smartphones (5.4″ and smaller) are expected to drop only 12% ($264 from $232) during the same time frame.”
Platform Highlights:
Android: In terms of share, IDC does not expect much to change as Android will maintain greater than 85% of the smartphone market. Google’s introduction of Daydream and Project Tango will help usher in new use cases and will help participating hardware vendors to offer differentiated experiences in the premium segment. The latest release of Nougat and Google’s ongoing ambition to secure Android will help the OS secure a better footing in the commercial segment. Overall Android’s ASP is set to remain flat in 2016 ($217) compared to last year and will decrease to $190 by 2020.
iOS: The removal of the headphone jack and the expectation of a significant hardware refresh in 2017 – the tenth anniversary of the iPhone – are contributors to the first full-year decline in iPhone shipments in 2016. However, IDC does expect a rebound in 2017 and beyond as iPhones reach nearly a quarter billion units in 2020.
Windows Phone: IDC anticipates further decline in Windows Phone’s market share throughout the forecast. Although the platform recently saw a new device launch from one of the largest PC vendors, the device (like the OS) remains highly focused on the commercial market. Future device launches, whether from Microsoft or its partners, are expected to have a similar target market.
|
Worldwide Smartphone Shipments by OS, Market Share, and Annual Growth (shipments in millions) |
|||||||
|
Platform |
2016 Shipment Volume* |
2016 Market Share* |
2016 YoY Growth* |
2020 Shipment Volume* |
2020 Market Share* |
2020 YoY Growth* |
5 Year CAGR* |
|
Android |
1,246.2 |
85.3% |
6.7% |
1,507.1 |
85.7% |
4.4% |
5.2% |
|
iOS |
203.8 |
13.9% |
-12.0% |
249.2 |
14.2% |
3.4% |
1.5% |
|
Windows Phone |
7.2 |
0.5% |
-75.2% |
1.7 |
0.1% |
-23.2% |
-43.4% |
|
Others |
3.9 |
0.3% |
-56.5% |
0.8 |
0.0% |
-3.9% |
-38.7% |
|
Total |
1,461.2 |
100.0% |
1.6% |
1,758.8 |
100.0% |
4.2% |
4.1% |
|
Source: IDC Worldwide Quarterly Mobile Phone Tracker, September 1, 2016 |
|||||||

