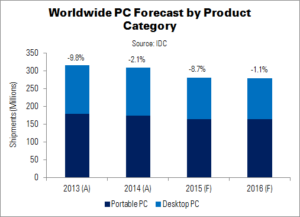
PC shipments will fall 8.7% YoY in 2015, and will not stabilise until 2017, says IDC. Growth will continue to decline through 2016, making it the fifth consecutive year of falling shipments. When growth resumes in 2017, it will be led by the commercial market. Consumer volumes will continue to decline – slowly – through 2019.
Q2’15 was initially expected to be a ‘transition period’, in which vendors prepared for the release of Windows 10 in July. However, shipments were down more than expected due to high notebook inventory from prior quarters, as well as ‘severe’ constraints posed by the decline of several major currencies relative to the US dollar.
As well as the economic issues, the PC market faced challenges from free upgrades to Windows 10; few new models are being released in the short term and channels are hesitant to invest in stock. Mobile devices can no longer be blamed as the sole culprit for the demise of PCs, IDC said. The combined volume of PCs, tablets and smartphones is expected to grow in single digits through 2019. Saturation and ‘good enough’ sentiments have spread into tablets. IDC expects these products to see further shipment declines this year.
In 2017, the prospect of the next refresh cycle and end of free Windows 10 upgrades are expected to provide opportunities for notebook and commercial PC growth. Emerging regions will also pick up slightly.
“Although the shortcomings of the PC business are obvious, a silver lining is that the industry has continued to refine the more mobile aspects of personal computers – contributing to higher growth in convertible and ultraslim notebooks”, said Jay Chou, senior research analyst at IDC. “The de-emphasis of touch on Windows 10 also paves the way for a more familiar experience and continuing unit growth on large-screen systems, particularly All-in-One PCs”.
| PC Shipments by Product Category and Region (Millions) | ||||||
|---|---|---|---|---|---|---|
| Product Category | Region | 2015 Shipments (F) | 2019 Shipments (F) | 2015 Market Share | 2019 Market Share | 5-Year CAGR |
| Portable PC | Mature | 87.6 | 90.5 | 31.1% | 32.1% | 0.8% |
| Emerging | 76.8 | 82.2 | 27.3% | 29.2% | 1.7% | |
| Portable PC Total | 164.4 | 172.8 | 58.4% | 61.3% | 1.2% | |
| Desktop PC | Mature | 44.6 | 39.3 | 15.9% | 13.9% | -3.1% |
| Emerging | 72.5 | 70.0 | 25.8% | 24.8% | -0.9% | |
| Desktop PC Total | 117.2 | 109.3 | 41.6% | 38.7% | -1.7% | |
| Total PC | Mature | 132.2 | 129.8 | 47.0% | 46.0% | -0.5% |
| Emerging | 149.4 | 152.2 | 53.0% | 54.0% | 0.5% | |
| Grand Total | 281.6 | 282.1 | 100.0% | 100.0% | 0.0% | |
| Source: IDC | ||||||

