Yes, I recently got a QD-OLED. Yes, I will ruin a perfectly amazing looking $2000 TV. But not today.

I have been dying to get my hands on a Samsung S95B ever since seeing it at SID Display Week in May. Nearly everyone agrees it’s the best-looking display they have ever laid eyes on. When I do take it apart, I will of course take a video and share the results, but for now, I want to discuss an interesting finding relating to the front of screen color.
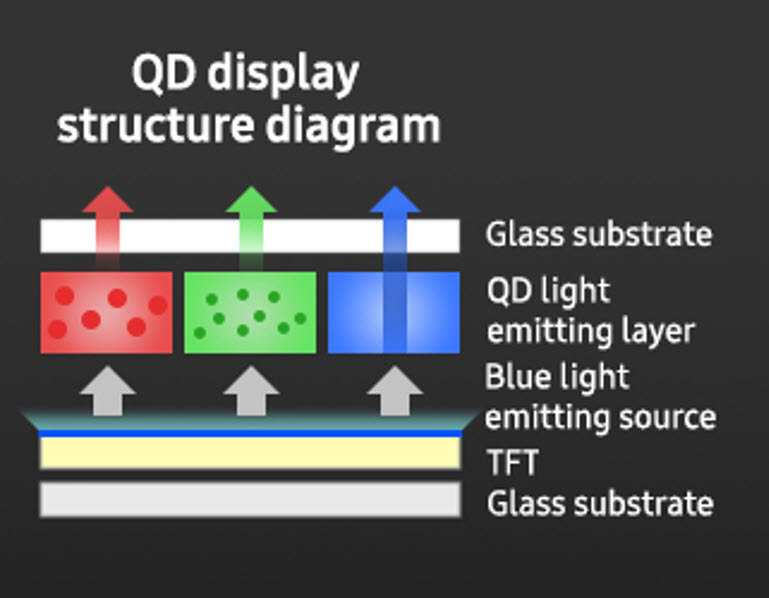
As you likely already know, QD-OLED panels create their red and green colors by converting a blue OLED into red and green via quantum dots (QDs). A basic marketing diagram provided by Samsung looks like this:
Using my trusty Avantes spectrometer, I measured the white spectrum at the front of screen which contains the blue OLED emission along with red/green QD color converted light.
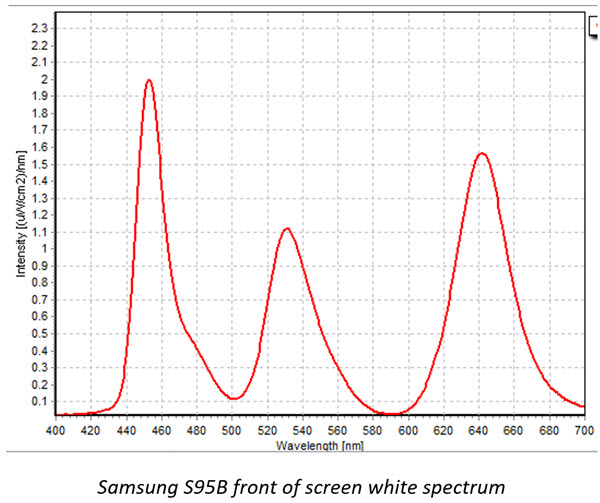
Nothing too surprising here, the blue OLED has a main peak just north of 450 nm with a bit of a shoulder peak. The green peak is centered at 531 nm (31 nm FWHM) and red at 641 nm (35 nm FWHM). Interestingly the green peak width (FWHM) is a little narrower than I would have expected, coming in at 31 nm, although it is a bit asymmetric. There could be a lot of things contributing to this within the green sub-pixel including contribution from a green emitter in the OLED stack (I’m still working on confirming this empirically), strong QD re-absorption, and the presence of optical filters in the stack before light reaches the front of the screen.
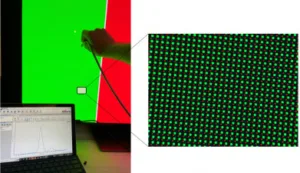
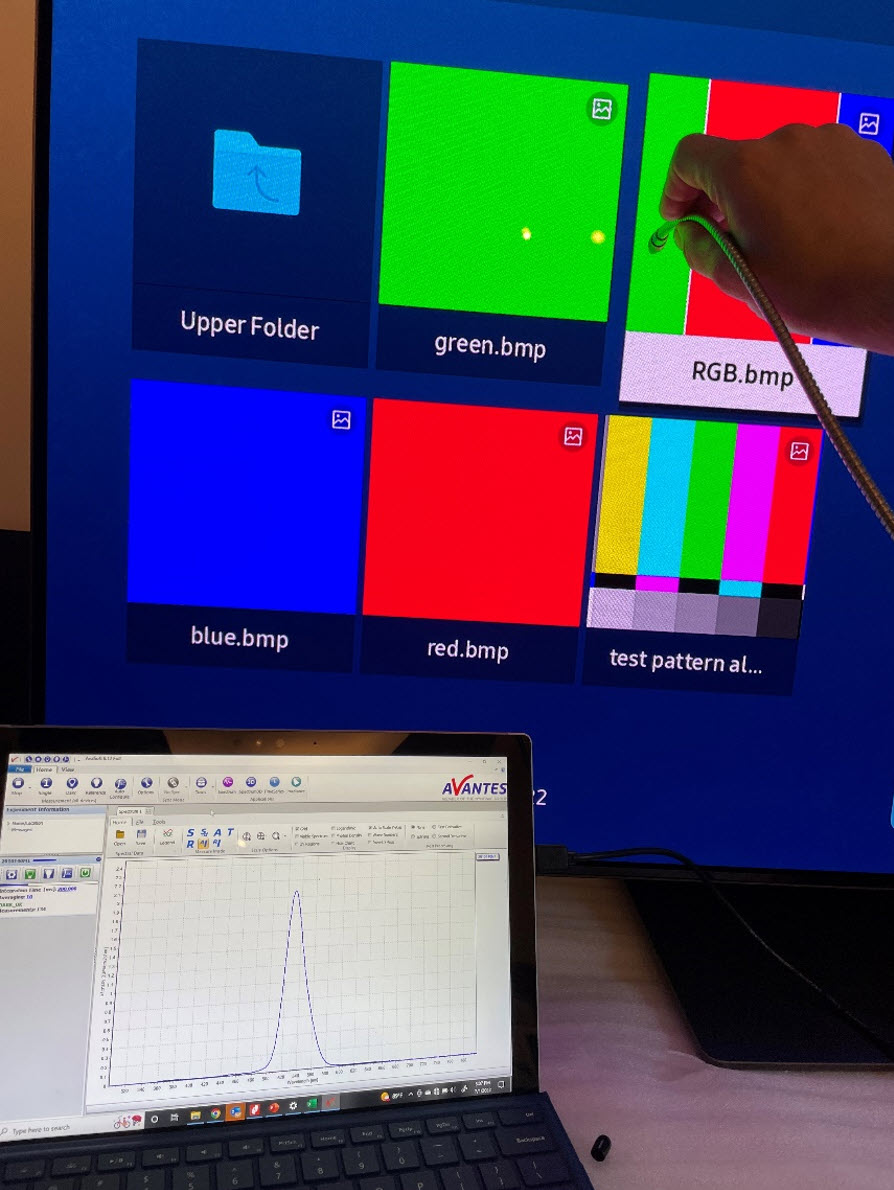
When I started measuring single colors things began to get interesting. What I generally do when measuring color is either download or create a test pattern graphic that contains pure red, green, and blue. I typically feed this through and HDMI cable from my laptop. When I measured pure green something stuck out. Can you see it?
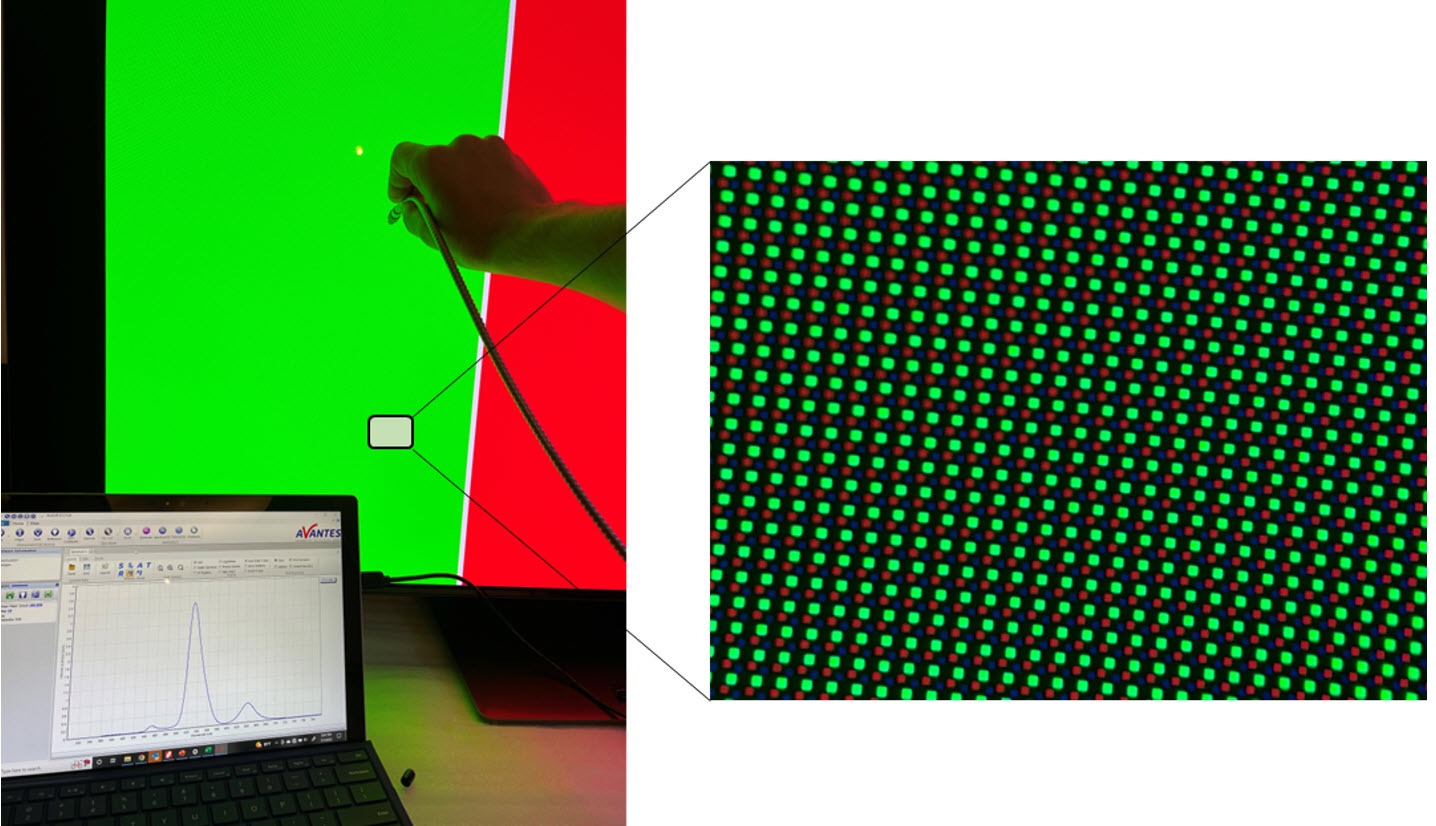 Left: Measuring green from a test pattern. Notice the optical signature displayed on the laptop. Right: Close up of compressed “green” showing that the red pixels are in fact contributing to the green color.
When measuring the “green” swatch I noticed the expected strong green peak, but also significant contribution from red, and even a little bit from blue. This even shows up in the close up of the pixels.
So what is happening here? Color gamut mapping (or compression).
Essentially, if the display were to show a pure green (no contribution from blue and red) then the green color point would fall outside of DCI-P3. Content creators are not regularly making content in Rec2020 at the moment, so the largest usable gamut is actually P3. To shift the green color point some red and green is added which brings it to within the P3 color space. I know, seems a little silly when we tout how amazing the peak width is for QDs then we artificially degrade the color purity. But for now, this is necessary until we have more content in Rec2020. It’s a bit of a chicken and egg problem.
This still left me wanting more. I really wanted to see what true green (and red and blue) the display could perform. But in order to do that I would have to get around the color gamut mapping algorithm. I tried the various display settings but to no avail. Upon recommendation from a friend, I decided to use a USB drive loaded with the test patterns and pure R/G/B colors. Then I measured both the thumbnail graphic (see below) and the fully opened image (as in graphic above where I’m measuring green).
 Measuring green from a test pattern in the thumbnail graphic (not fully opened)
What do you know, it worked! For some reason the software in the display does not apply the color mapping algorithm to thumbnails from USB drives, so now I am able to measure a pure color spectrum!
I did this with all three colors, and the resulting optical spectra are summarized below. You can clearly see that in each case the “native” spectrum is purer than the “compressed” spectrum.
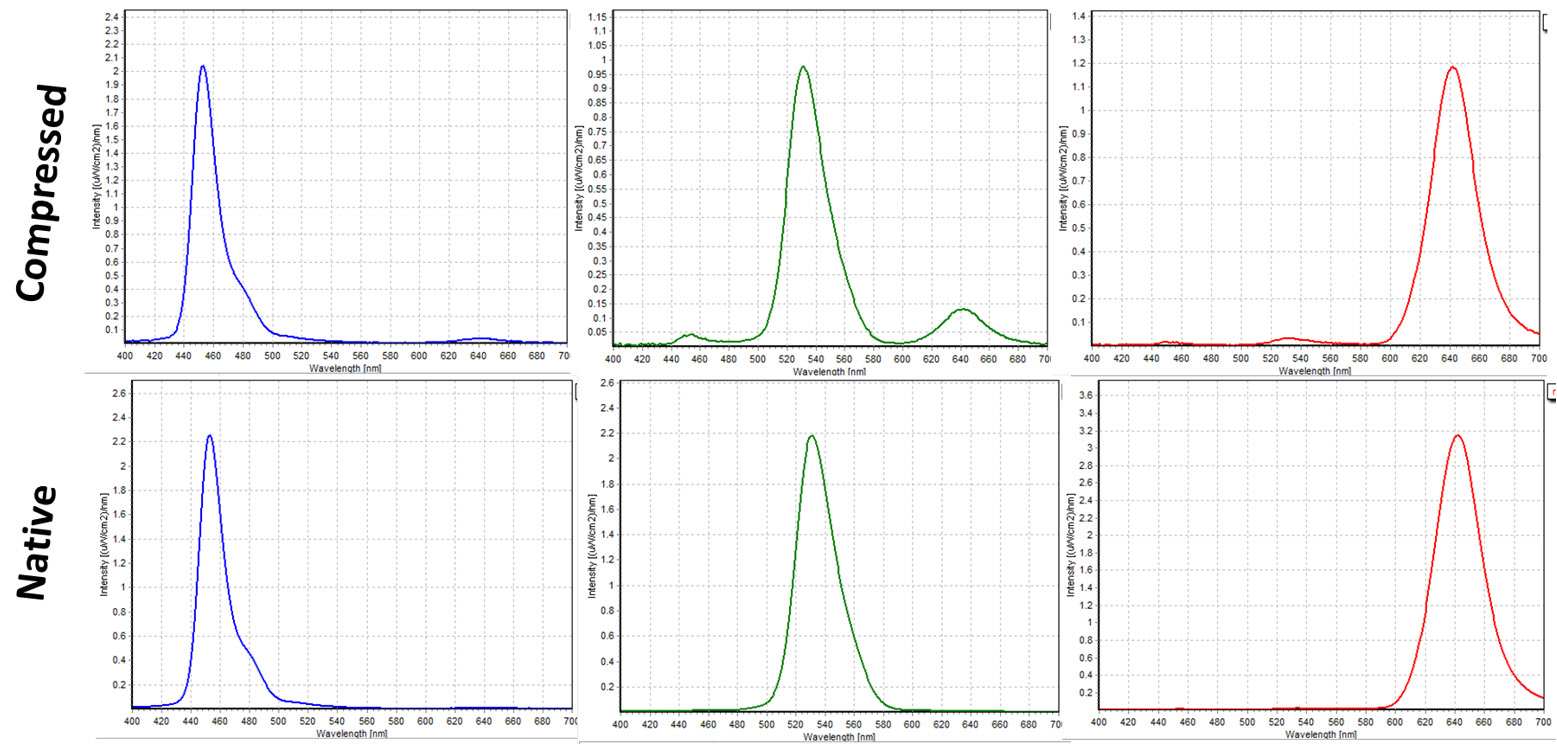 Optical spectra of all three colors in their compressed form and native form. Green is clearly the most impacted by this effect.
From a 2D color gamut perspective, it’s clear how the spectral changes contribute to the green color point.
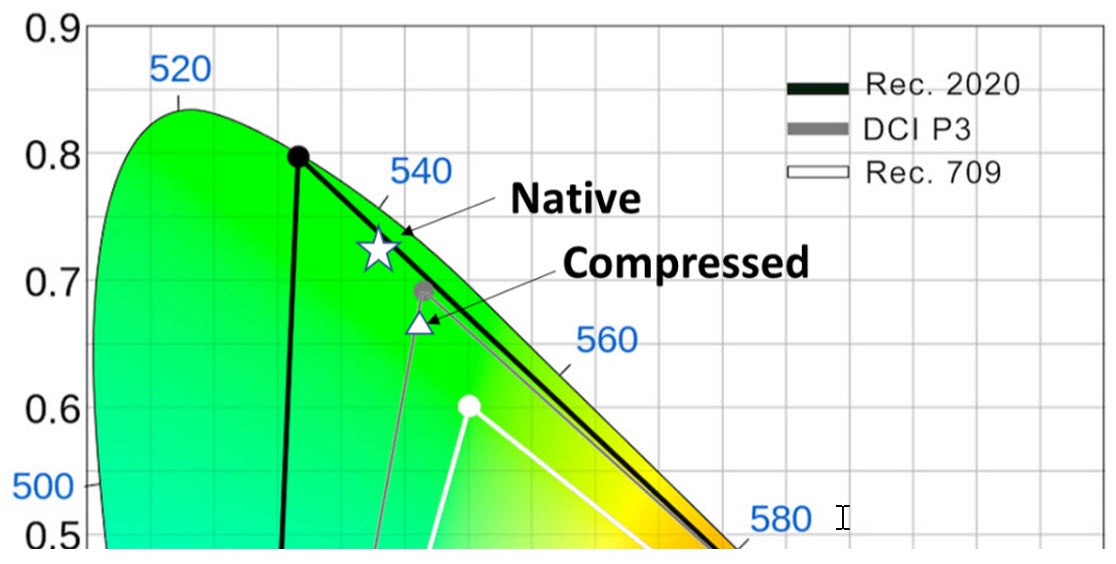 Change in green color point of QD-OLED display with and without gamut compression.
Even though the display is shrinking the potential gamut, rest assured this TV still looks incredible. What strikes me is the excellent viewing angle and brightness, even in my brightly lit office. No camera can do it justice, so I recommend going to see one for yourself. I eagerly await the days when Rec2020 content is more widely available, and TVs no longer need to steal my gamut! (PP)
Peter Palomaki is the owner and chief scientist at Palomaki Consulting, a firm specializing in helping companies solve big problems at the nanoscale. His utilizes his expertise in quantum dots and materials chemistry to solve challenging problems with clients large and small.