Global smartphone sales reached 403 million units in Q4’15, says Gartner: a 9.7% rise YoY. However, this was the slowest Q4 growth rate since 2008. Smartphone sales rose 14.4% YoY, to 1.4 billion units, for 2015 as a whole.
Driving factors continued to be low-cost phones in emerging markets, as well as strong demand for premium models. Research director Anshul Gupta said that aggressive pricing from local and Chinese brands, in the midrange and entry-level segments of emerging markets, led to consumers upgrading to affordable smartphones more quickly.
85% of users in APAC are replacing their current midrange phone with a model in the same category, said Gupta. Vendors that import devices are feeling further margin pressure due to the devaluation of the US dollar. Market conditions are prompting ‘some’ vendors to consider establishing manufacturing operations in India and Indonesia; such a move would avoid unfavourable currency devaluations and high import taxes in the future.
| Worldwide Smartphone Sales to End Users by Vendor in Q4’15 (000s) | ||||
|---|---|---|---|---|
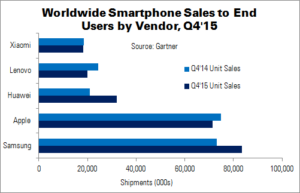
| Vendor | Q4’15 Unit Sales | Q4’14 Unit Sales | Q4’15 Share | Q4’14 Share |
| Samsung | 83,437.7 | 73,031.5 | 20.7% | 19.9% |
| Apple | 71,525.9 | 74,831.7 | 17.7% | 20.4% |
| Huawei | 32,116.5 | 21,038.1 | 8.0% | 5.7% |
| Lenovo | 20,014.7 | 24,299.9 | 5.0% | 6.6% |
| Xiaomi | 18,216.6 | 18,581.6 | 4,5% | 5.1% |
| Others | 177,798.0 | 155,551.6 | 44.1% | 42.3% |
| Total | 403,109.4 | 367,334.4 | 100.0% | 100.0% |
| Source: Gartner | ||||
Of the top five vendors in Q4, only Samsung and Huawei managed to raise their sales to end users. Apple suffered its first-ever smartphone decline, with sales down 4.4%.
Samsung led the market, but challenges remained. The company must introduce flagship smartphones that can compete with the iPhone, Gupta advised. Apple came second and Huawei – with 53% sales growth – was in third place. Huawei achieved the best YoY performance in Q4, raising its profile outside of China.
| Worldwide Smartphone Sales to End Users by Vendor in 2015 (000s) | ||||
|---|---|---|---|---|
| Vendor | 2015 Unit Sales | 2014 Unit Sales | 2015 Share | 2014 Share |
| Samsung | 320,219.7 | 307,596.9 | 22.5% | 24.7% |
| Apple | 225,850.6 | 191,425.8 | 15.9% | 15.4% |
| Huawei | 104,094.7 | 68,080.7 | 7.3% | 5.5% |
| Lenovo | 72,748.2 | 81,415.8 | 5.1% | 6.5% |
| Xiaomi | 65,618.6 | 56,529.3 | 4.6% | 4.5% |
| Others | 635,368.5 | 539,691.3 | 44.6% | 43.4% |
| Total | 1,423,900.3 | 1,244,739.8 | 100.0% | 100.0% |
| Source: Gartner | ||||
Samsung was also the top vendor in overall 2015 sales of smartphones, although share was down 2.2 percentage points. Apple’s share was up 0.5 percentage points, to 15.9%, after selling 225.9 million iPhones. Huawei rose from 5.5% to 7.3%, approaching 104 million units sold.
In terms of smartphone operating systems, Android maintained its lead, with share rising 16.6% (to 80.7% of the global total). This was thanks to continued demand for affordable smartphones and the slowdown of iOS units in Q4. However, Apple did manage to narrow its gap with Samsung in the premium quarter for 2015 as a whole.
| Worldwide Smartphone Sales to End Users by Operating System in Q4’15 (000s) | ||||
|---|---|---|---|---|
| Vendor | Q4’15 Unit Sales | Q4’14 Unit Sales | Q4’15 Share | Q4’14 Share |
| Android | 325,394.4 | 279,057.5 | 80.7% | 76.0% |
| iOS | 71,525.9 | 74,831.7 | 17.7% | 20.4% |
| Windows | 4,395.0 | 10,424.5 | 1.1% | 2.8% |
| Blackberry | 906.9 | 1,733.9 | 0.2% | 0.5% |
| Others | 887.3 | 1,286.9 | 0.2% | 0.4% |
| Total | 403,109.4 | 367,334.4 | 100.0% | 100.0% |
| Source: Gartner | ||||