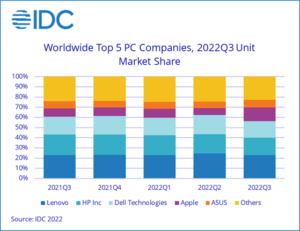
Declines continued for the traditional PC market as global shipments totaled 74.3 million units during the third quarter of 2022 (3Q22), according to preliminary results from the International Data Corporation (IDC) Worldwide Quarterly Personal Computing Device Tracker.
Cooling demand and uneven supply have contributed to a year-over-year contraction of 15.0%. However, shipment volumes remain well above pre-pandemic levels when PC volumes were largely driven by commercial refreshes due to the looming end of support for Windows 7.
“Consumer demand has remained muted though promotional activity from the likes of Apple and other players has helped soften the fall and reduce channel inventory by a couple weeks across the board,” said Jitesh Ubrani, research manager for IDC’s Mobility and Consumer Device Trackers. “Supply has also reacted to the new lows by reducing orders with Apple being the only exception as their third quarter supply increased to make up for lost orders stemming from the lockdowns in China during the second quarter.”
“In addition to shipment volumes, we’ll be keeping a close eye on how average selling prices (ASPs) trend this quarter,” added Linn Huang, research vice president, Devices & Displays at IDC. “Shortages over the last several years have aggressively driven product mix shifts towards the premium end. This, coupled with cost increases of components and logistics, drove ASPs up five quarters in a row to $910 in 1Q22, the highest since 2004. However, with demand slowing, promotions in full swing, and orders being cut, the ASP climb was reversed in 2Q22. Another quarter of ASP declines indicates a market in retreat.”
|
Top 5 Companies, Worldwide Traditional PC Shipments, Market Share, and Year-Over-Year Growth, Q3 2022 (Preliminary results, shipments are in thousands of units) |
|||||
|
Company |
3Q22 Shipments |
3Q22 Market Share |
3Q21 Shipments |
3Q21 Market Share |
3Q22/3Q21 Growth |
|
1. Lenovo |
16,880 |
22.7% |
20,129 |
23.1% |
-16.1% |
|
2. HP Inc. |
12,706 |
17.1% |
17,603 |
20.2% |
-27.8% |
|
3. Dell Technologies |
11,963 |
16.1% |
15,184 |
17.4% |
-21.2% |
|
4. Apple |
10,060 |
13.5% |
7,174 |
8.2% |
40.2% |
|
5. ASUS |
5,540 |
7.5% |
6,011 |
6.9% |
-7.8% |
|
Others |
17,103 |
23.0% |
21,218 |
24.3% |
-19.4% |
|
Total |
74,252 |
100.0% |
87,319 |
100.0% |
-15.0% |
|
Source: IDC Quarterly Personal Computing Device Tracker, October 10, 2022 |
|||||
Notes:
– Some IDC estimates prior to financial earnings reports. Data for all companies are reported for calendar periods.
– Shipments include shipments to distribution channels or end users. OEM sales are counted under the company/brand under which they are sold.
– Traditional PCs include Desktops, Notebooks, and Workstations and do not include Tablets or x86 Servers. Detachable Tablets and Slate Tablets are part of the Personal Computing Device Tracker but are not addressed in this press release.

