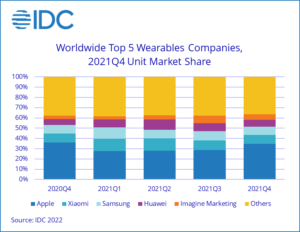
The worldwide wearables market hit a new record high in the fourth quarter of 2021 (4Q21) as shipments reached 171 million units, up 10.8% from the same quarter last year, according to new data from the International Data Corporation (IDC) Worldwide Quarterly Wearable Device Tracker.
New products and continued demand for health and fitness tracking products along with hearables helped the market maintain its momentum. Shipments for the full year 2021 totaled 533.6 million units, an increase of 20.0% over 2020.
Hearables were once again the leading category as shipment volume grew 9.6% during the quarter and accounted for almost two-thirds of the entire wearables market. Meanwhile, watches continued to steal share from wristbands as the larger form factor offers consumers more features and customization. Lesser-known categories such as glasses (those without displays), rings, connected shoes, and others managed to grow 94.1% during the quarter largely due to products like the Oura Ring and Facebook/Ray-Ban Stories.
“While supply has been a constant battle for many companies during 2021, many of the issues began to subside during the quarter and allowed brands to ship record volumes while broadening their product lines,” said Jitesh Ubrani, research manager for IDC Mobility and Consumer Device Trackers. “However, the supply cruch also forced many companies to think about services and this is likely going to play a key role in the wearbles market moving forward as OEMs can experiment with their business models by subsidzing the hardware purchase though on-going services revenue.”
“Although Apple remained far out front for the year, another telling sign of the market is the long list of vendors coming afterwards,” notes Ramon T. Llamas, research director, Mobile Devices and AR/VR at IDC. “Samsung, Huawei, and Imagine Marketing all posted market-beating year-over-year growth, as did our collective ‘Others’ group. That shows demand is spreading out to other companies and products, all of which bring added diversity and price competition to attract and retain more customers. And because there is still strong demand from first-time users, vendors can court them with features similar to Apple’s products but at much lower price points.”
4Q21 Company Highlights
Apple retained the number 1 position as it captured 34.9% share during the quarter. Broad availability of the Series 7 watches after being delayed from Q3 to Q4 of 2021 and the launch of the AirPods 3 helped drive Apple’s growth during the quarter.
With Xiaomi’s wristbands in decline, the company has been able to grow and preserve its position as a market leader by focusing on watches, which doubled in volume during the quarter, as well as hearables.
Samsung’s Galaxy Watch 4 Series was heavily promoted during the holiday season through discounts and trade-in offers and the activity paid off as the company managed to gain 3 percentage points in the smartwatch market during the quarter compared to the holiday season in 2020. However, growth in the hearables category did start to slow as the company’s shipments grew 4.3%, notably less than the 9.5% growth for the category overall during the quarter.
Huawei’s growth was impressive – 35.6% during the quarter – and the company has managed to gain traction outside China thanks to aggressive marketing. European-bound shipments represented 29% of Huawei’s portfolio during the 2021 holiday season, up from 19.9% in the prior year.
Imagine Marketing rounded out the top 5 thanks to the rapid growth of all wearables within India. The company’s prominent BoAt brand has reigned supreme thanks to a high-value, low-cost strategy that’s worked extremely well for its hearables and watch business. Average watch prices are well below $50 and it’s one of the main reasons the wristband market has faced challenges in recent quarter.
Top 5 Wearable Device Companies by Shipment Volume, Market Share, and Year-Over-Year Growth, Q4 2021 (shipments in millions) |
|||||
|
Company |
4Q21 Shipments |
4Q21 Market Share |
4Q20 Shipments |
4Q20 Market Share |
Year-Over-Year Growth |
|
1. Apple |
59.7 |
34.9% |
55.6 |
36.0% |
7.3% |
|
2. Xiaomi |
14.6 |
8.6% |
13.6 |
8.8% |
7.9% |
|
3. Samsung |
13.6 |
7.9% |
13.1 |
8.5% |
3.8% |
|
4. Huawei |
11.5 |
6.7% |
8.5 |
5.5% |
35.6% |
|
5. Imagine Marketing |
9.2 |
5.4% |
5.4 |
3.5% |
69.6% |
|
Others |
62.5 |
36.6% |
58.2 |
37.7% |
7.4% |
|
Total |
171.0 |
100.0% |
154.3 |
100.0% |
10.8% |
|
Source: IDC Worldwide Quarterly Wearable Device Tracker, March 9, 2022 |
|||||
Top 5 Wearable Device Companies by Shipment Volume, Market Share, and Year-Over-Year Growth, Calendar Year 2021 (shipments in millions) |
|||||
|
Company |
2021 Shipments |
2021 Market Share |
2020 Shipments |
2020 Market Share |
Year-Over-Year Growth |
|
1. Apple |
161.8 |
30.3% |
151.5 |
34.1% |
6.8% |
|
2. Xiaomi |
54.4 |
10.2% |
50.8 |
11.4% |
7.1% |
|
3. Samsung |
48.1 |
9.0% |
40.1 |
9.0% |
20.1% |
|
4. Huawei |
42.7 |
8.0% |
34.0 |
7.6% |
25.6% |
|
5. Imagine Marketing |
26.8 |
5.0% |
10.2 |
2.3% |
163.4% |
|
Others |
199.9 |
37.5% |
158.2 |
35.6% |
26.3% |
|
Total |
533.6 |
100.0% |
444.7 |
100.0% |
20.0% |
|
Source: IDC Worldwide Quarterly Wearable Device Tracker, March 9, 2022 |
|||||

