I have been watching the issue of motion performance on LCD since I saw my first passive LCD that was so bad with anything moving on the display that those who have never seen one would scarcely believe it. Butt there was a big breakthrough in measuring blur when the MPRT metric was developed some twenty years ago.

What I liked about the Motion Picture Response Time (MPRT metric was that the researchers that developed it also did a lot to test the metric and found that it really seemed to correlate well with the subjective experience of viewers. However, MPRT had some significant weaknesses. For example, it only looked at levels between 10% and 90% of luminance, which is not unreasonable in metrology, but doesn’t tell the whole story. Further, like any metric, over the years, makers that want to get better numbers learn how to optimise their designs to get better numbers but without actually making the image better for viewers – or worse, degrading it in the pursuit of better metrics.
Some panel makers also quote grey-to-grey numbers in milliseconds and that doesn’t mean much at all in terms of overall image quality.
Overdriving and Undershooting
One of the main way that display makers got better MPRT numbers was by overdriving and undershooting the signals. These techniques use voltages higher (or lower) than the final desired grey level to encourage the liquid crystal (LC) materials to move more rapidly. Some overdrive is a good idea – LC materials are pretty viscous and need some encouragement, but too much can cause serious artefacts in the image quality. That doesn’t show up in the numbers, so makers that avoid excessive over- or undershooting can be penalised in the market.
On top of that, the test conditions can be manipulated. LC materials are ‘somewhere between liquids and solids’ so even small temperature differences can make a big difference to the numbers, for example.
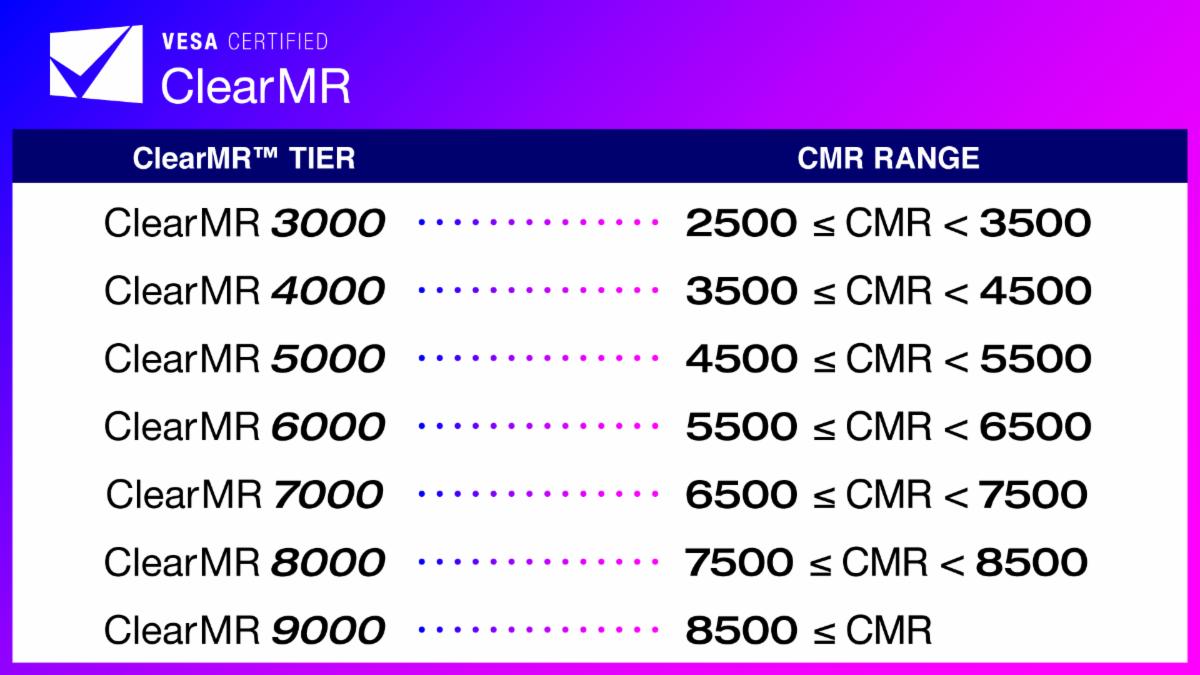
So VESA decided to look at the weak points in the MPRT metric and set out a new testing and certification scheme to help buyers to find the display that best suits their needs and budget and to ‘level the playing field’ by setting out stringent conditions including limits to the over and undershooting. It also wanted something that would work with the even higher resolution sets that are on the way and that was just as valid with LCDs and OLEDs. So, it has developed the ClearMR (Clear Mottion Ratio) logo programme and defined a number of levels for performance that reasonably correlate with differences that viewers would typically see.
We wanted to know more and spoke to Dale Stolitzka of Samsung Display on a call also with Roland Wooster of Intel to get more information. They are both on the VESA committee that came up with ClearMR.
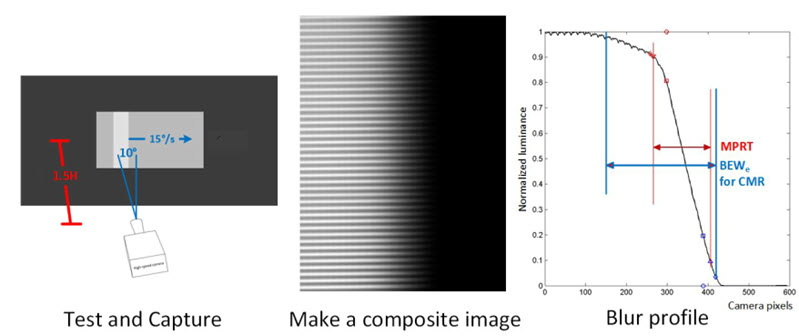
Stolitzka was the technical lead on the project. The ClearMR metric looks at the whole range of grey level changes. 14 sets of data are captured by a high speed camera, showing a moving block image going across the screen and taking around 4 seconds to go across the screen – the speed is set at 15 degrees of scan per second, measured at 1.5 screen heights. The sets use different parts of the luminance range (e.g. 0%-33%, 33%-66% and 66% to 100%) and the results are collated and aggregated to create an image of the data that shows the ‘Blur edge Width’ of the moving pattern. Once you have the image, you can work out the number of pixels that will be blurred and can express that as a ratio of all the pixels. That ratio, effectively becomes the rating level.
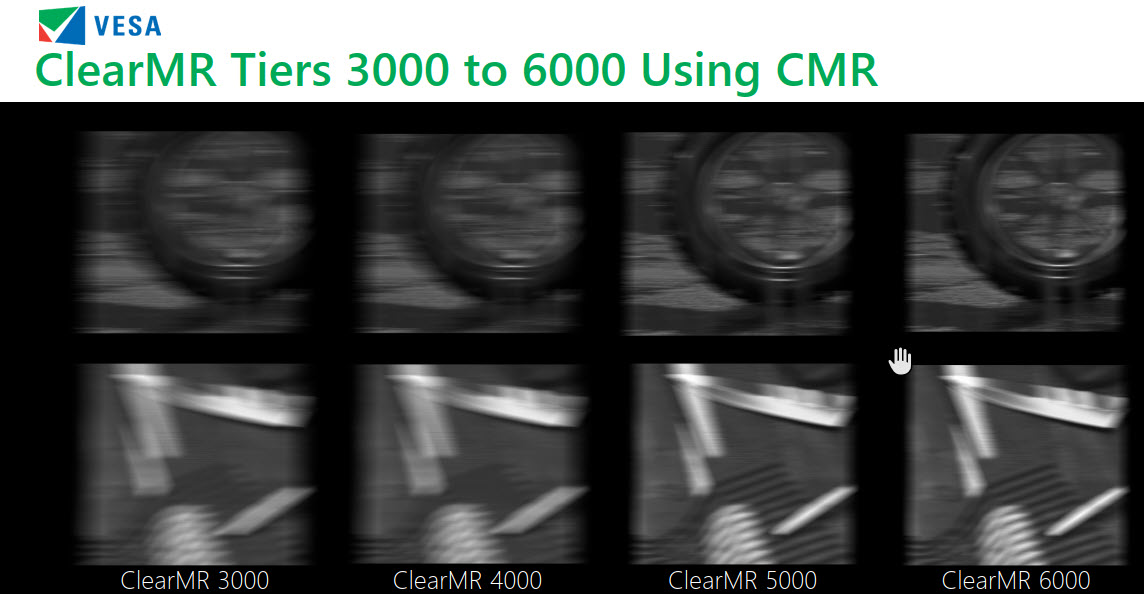
To validate the concept, Stolitzka simulated the different levels mathematically and produced sample images using several carefully chosen patterns and ‘real world’ images. On the call we went through them and he highlighted the different aspects (highlights, shadow detail etc). For example, in the image below, rain is falling in front of the tyre, but there is none apparent at the lowest two levels, while something is visible on the upper two.
Overdrive is limited to <20% and undershoot for the testing which is done by VESA’s qualified labs partly because the test depends on state-of-the-art high speed cameras. Ambient temperature is controlled and there is a specified warm-up period. (These conditions are broadly similar, but not identical to the conditions in VESA’s Adaptive Sync testing standard and Logo programme (VESA Improves Things for Gamers and Media Consumers). Backlight strobing is disabled (unless it is always on and cannot be switched off).
We asked about the logic of switching off the backlight strobing. Backlight strobing is a way of getting over the human factors that cause blurring in sample and hold addressed displays such as LCDs and OLEDs. This is not the place for a full discussion on that topic. However, Stolitzka said that the aim was to provide ‘fairness’ between different makers. He also pointed out that few are using the technique in monitors at the moment because of the impact on peak brightness and power consumption.
LCD vs OLED
In general, we heard, the 3000 level is likely to be applicable to current 90Hz LCDs, or 60Hz OLEDs. The 6000 level is likely to apply to 144-165Hz LCDs and sets should be ‘good performers’. There is still room for improvement, but the metric allows for further levels to be added as technology continues to develop. The tests also apply only to SDR content at the moment. Further work has to be done to validate how the metrics work on HDR content, but VESA will do that.
In summary, the new ClearMR programme looks like a significant improvement on the current state of affairs and being driven by VESA, we can be reasonably sure that the big suppliers are supporting it. There are already sets from LG and HP listed on the www.clearmr.org test site and sets are on their way from Samsung. (BR)