
 Source: DSCC
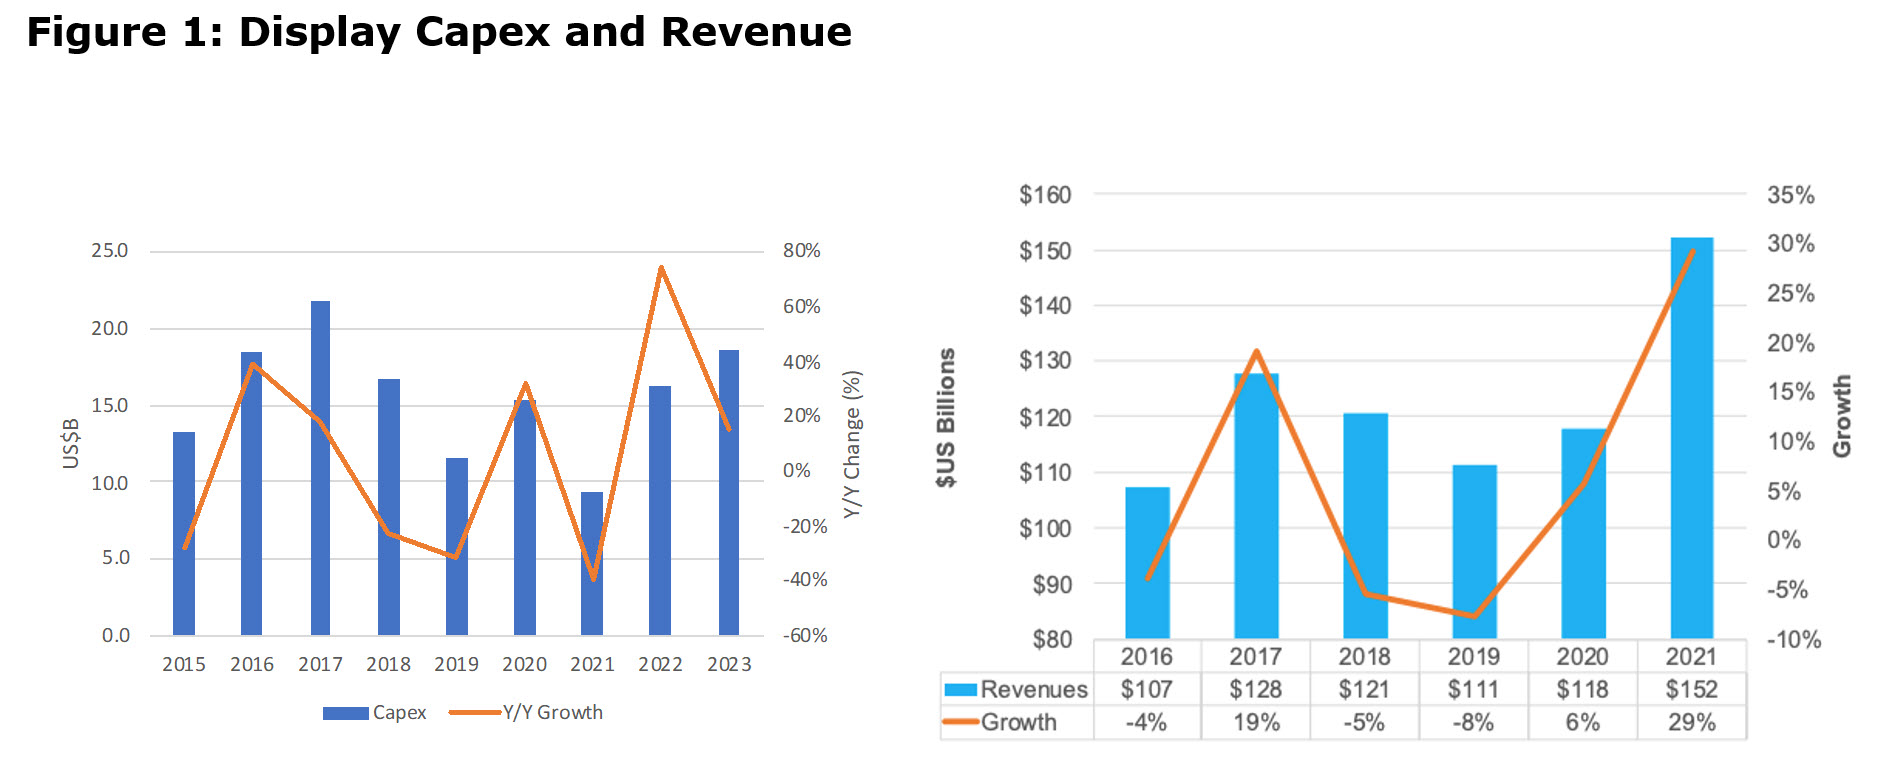
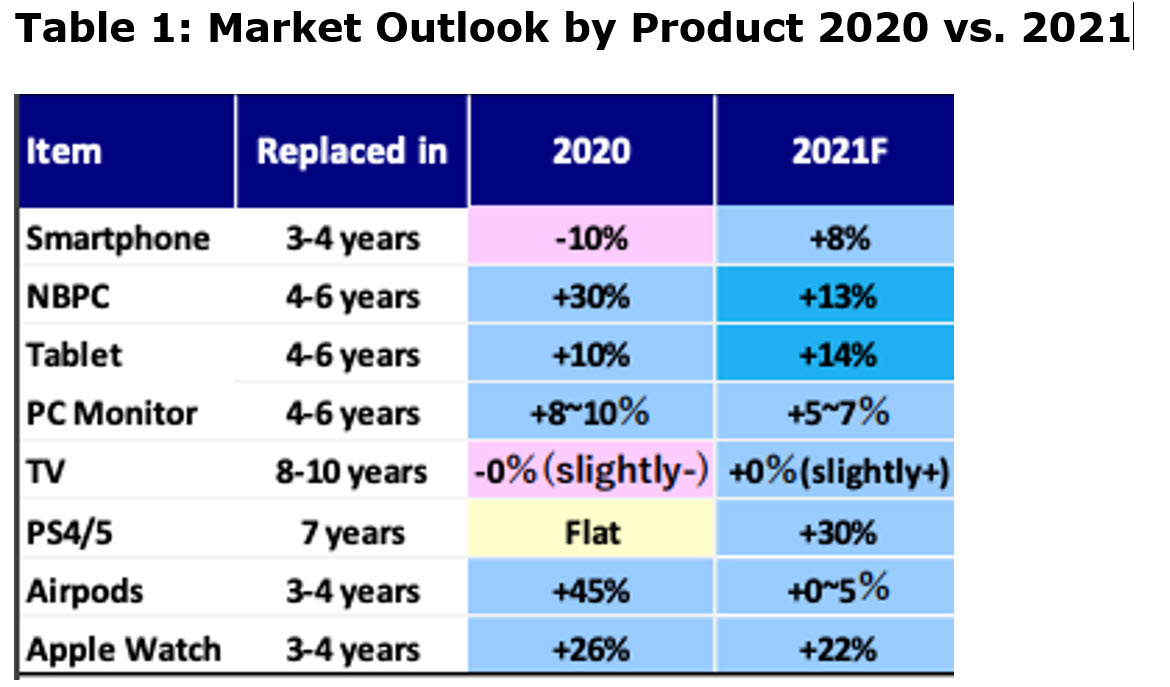
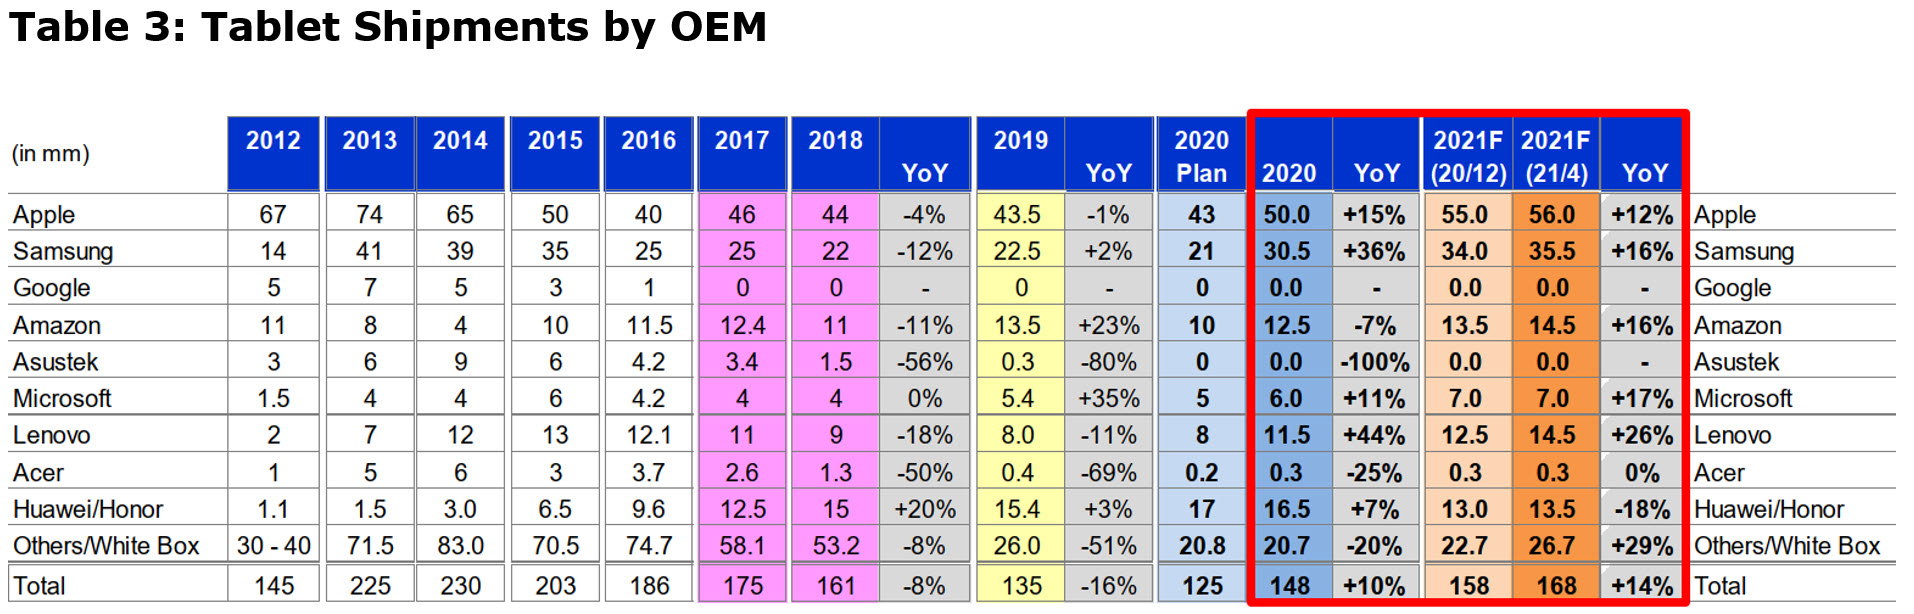
By application, the 2020 to 2021 comparison in the market outlook is positive as only PC monitors and Notebook PCs, which experienced strong growth in 2020, due to the work from home (WFH) phenomenon, AirPods and smartwatches are expected to grow more slowly in 2021 than 2020. Smartphones are expected to reach the 2019 levels of 1.4 billion units in 2021 and notebooks, PC monitors and tablets, which had 2020 growth rates of 30%, 10% and 10% respectively, are expected to flourish again in 2021. Total display revenue is forecast to grow to $150 billion in 2021, up 30% Y/Y, after three straight years of decline.
 Source: Mizhuo Securities
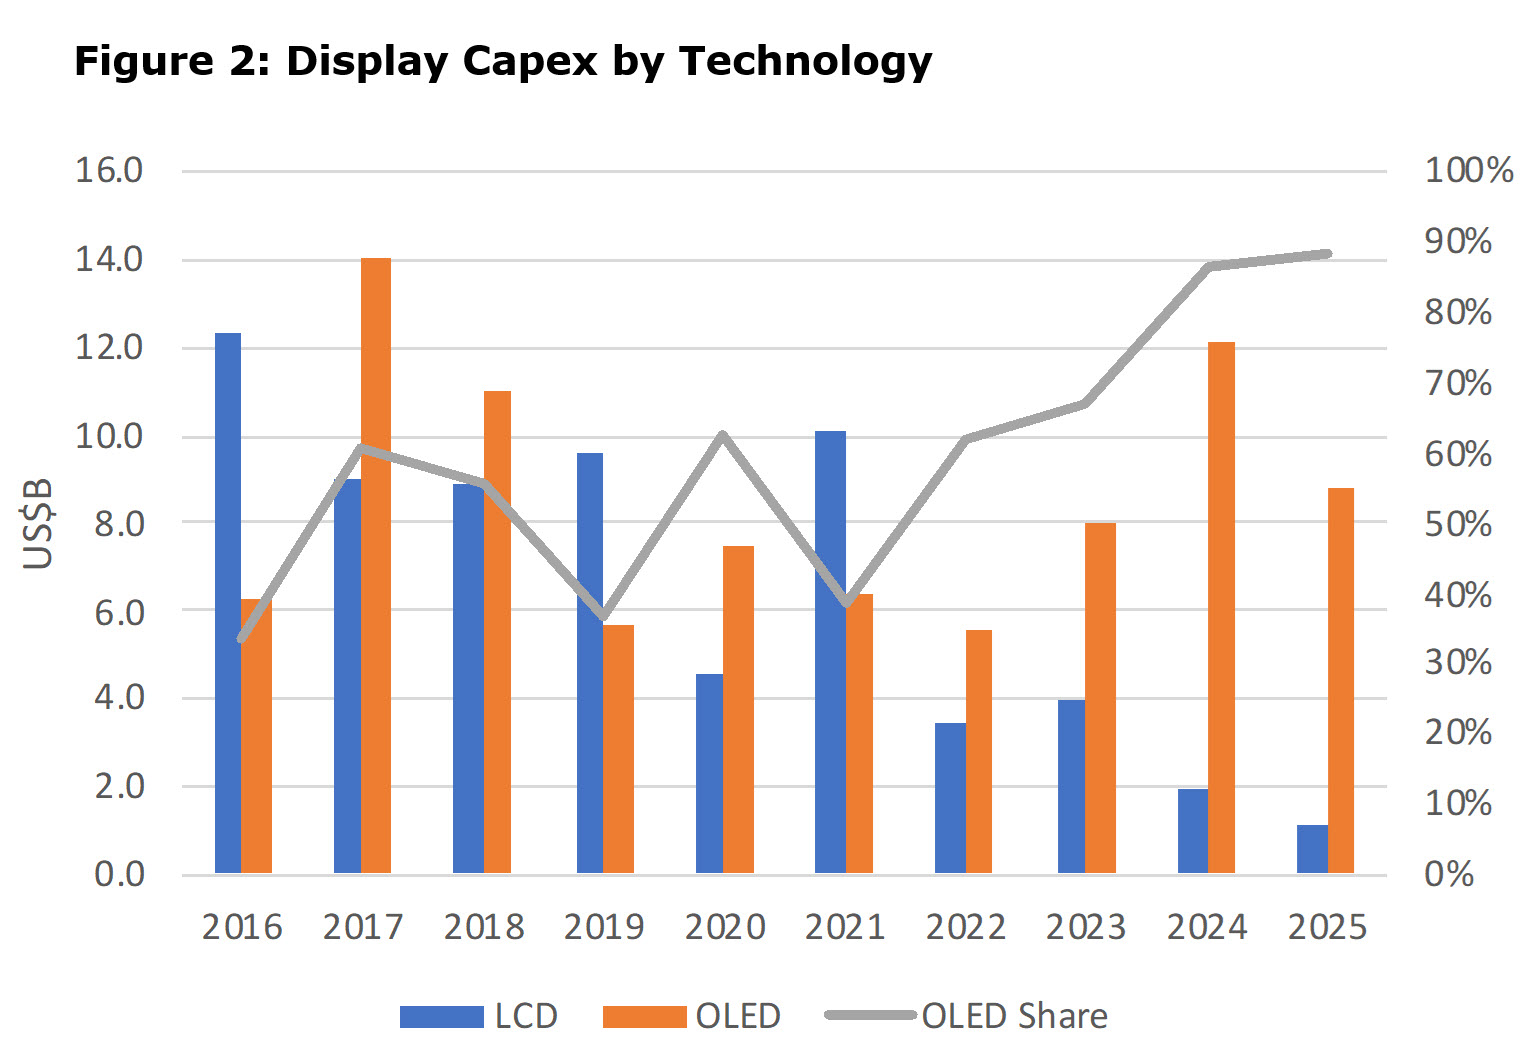
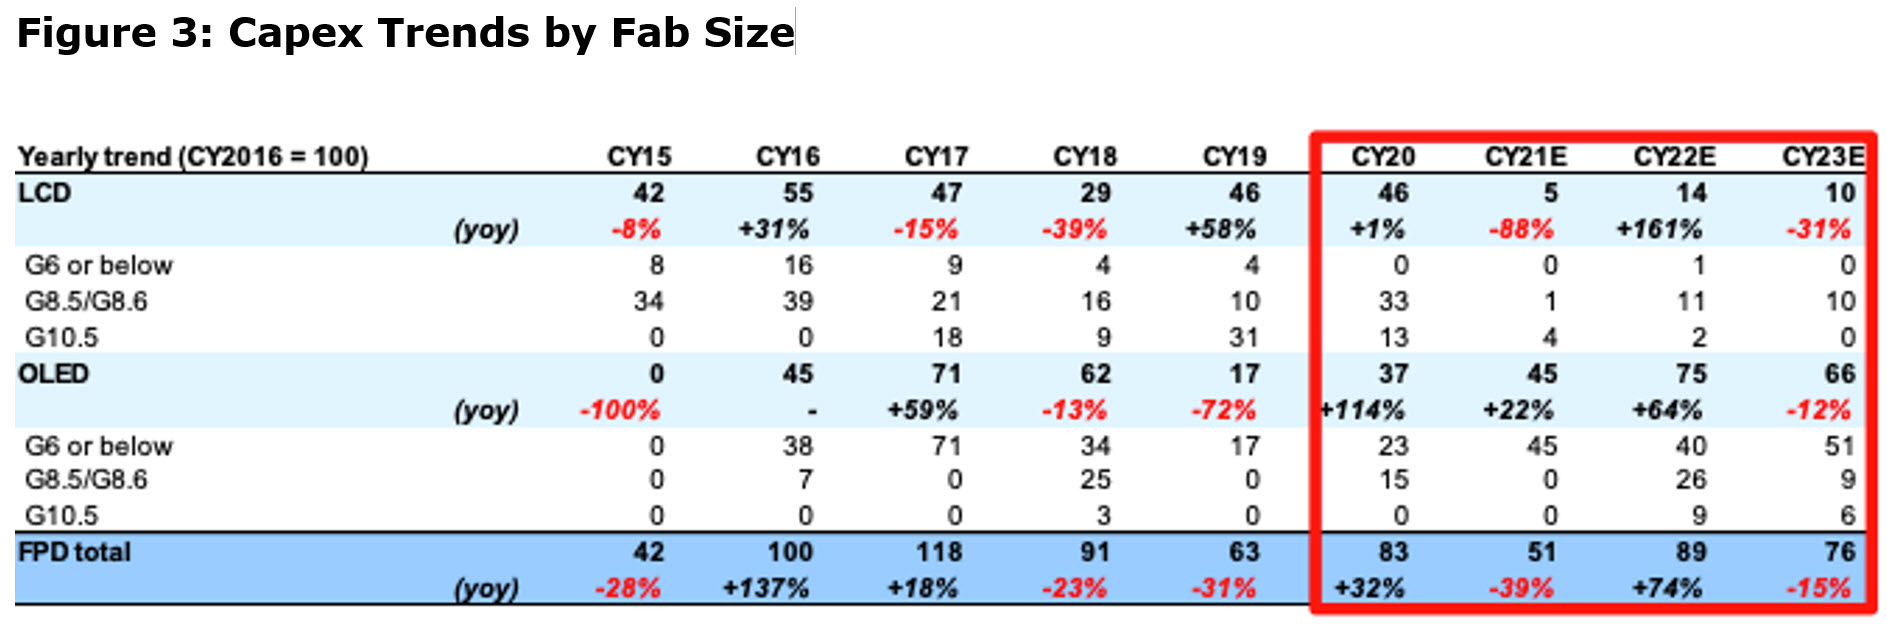
DSCC forecast an increase in LCD capex in 2021, compared to previous expectations, which would cut into the rapid price increases in large panels, while OLED capex is expected to peak in 2024 as new TV fabs (Gen 8.5) are installed by BOE and CSoT.
 Source: DSCC, OLED-A
Beyond 2021, LCD capex is expected to grow in 2022 for Gen 8.5/6 fabs and fall thereafter. OLED capex is expected to be down in 2021 compared to 2020, rise in 2022 and then drop slowly in 2023. Continued investment in China to meet smartphone demand is expected in each forward years, while OLED TV panel investment is undertaken by CSoT and BOE in 2022 and 2023 and then LG in 2023 with its Gen 10.5.
 Source: Mizhuo Securities
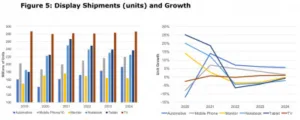
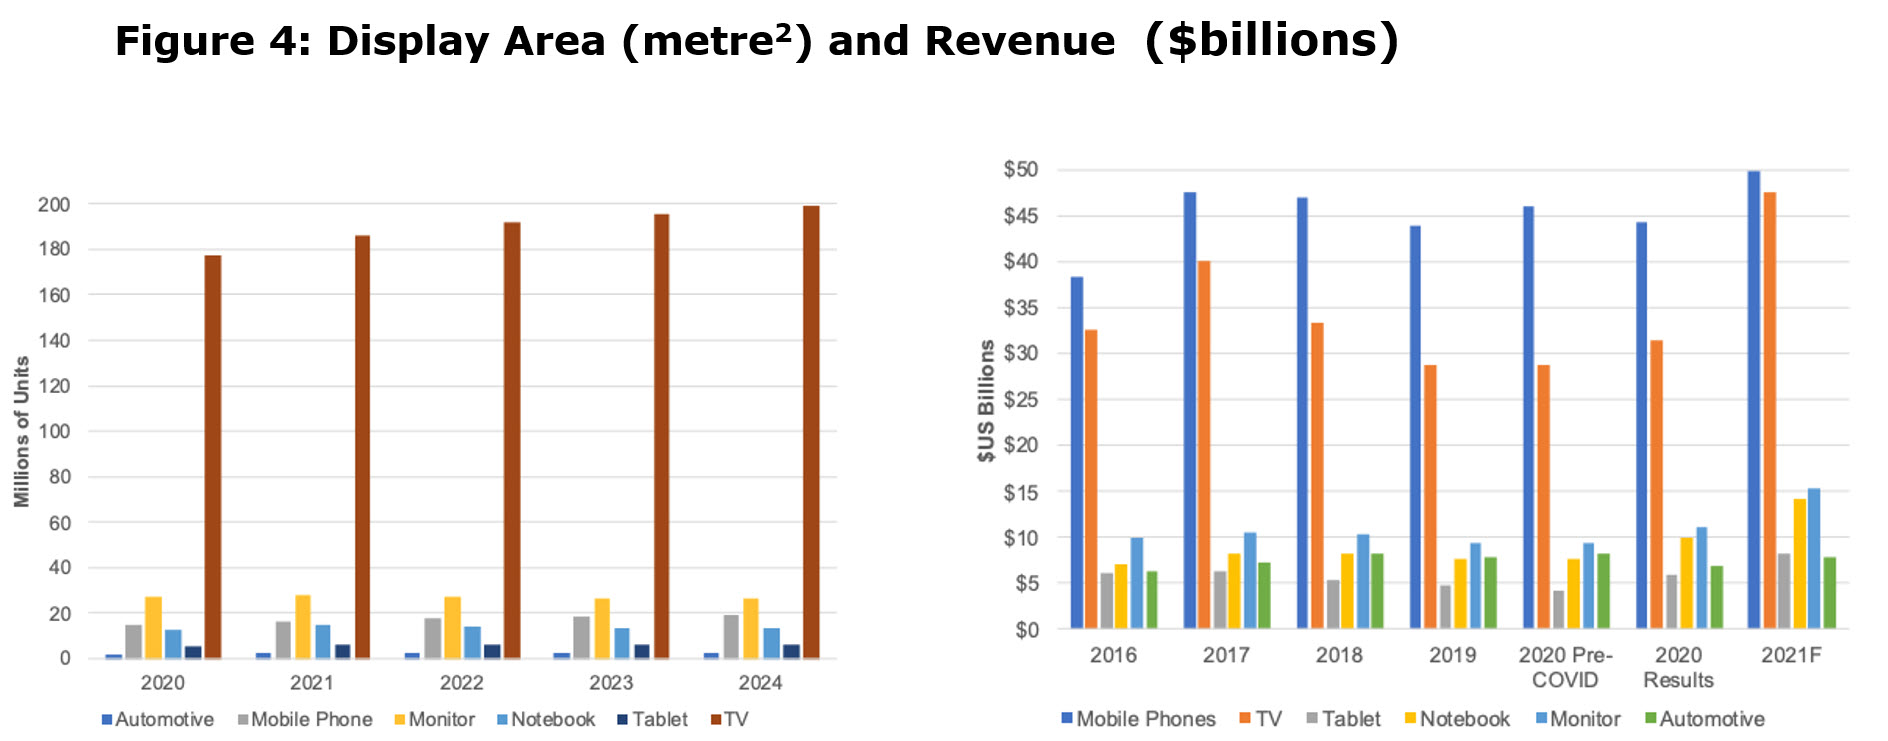
The growth in the average size of TV panels has made the application so dominant in terms of capacity utilization that it now represents over 80% of the total area in sq. metres produced by the industry at 180 million m2. By 2024, the share will increase, and the volume is expected to reach 200 million m2, while the other applications will remain steady. However, in terms of 2020 panel revenue, mobile phones outpaced TVs with $45 billion, whereas TVs generated $31.5 billion. DSCC expects TV revenues to grow to $48 billion in 2021, driven by larger sizes and higher ASPs, while mobile phone revenues rise to $50.6 billion. These two categories represent ~65% of total FPD revenue.
 Source: DSCC
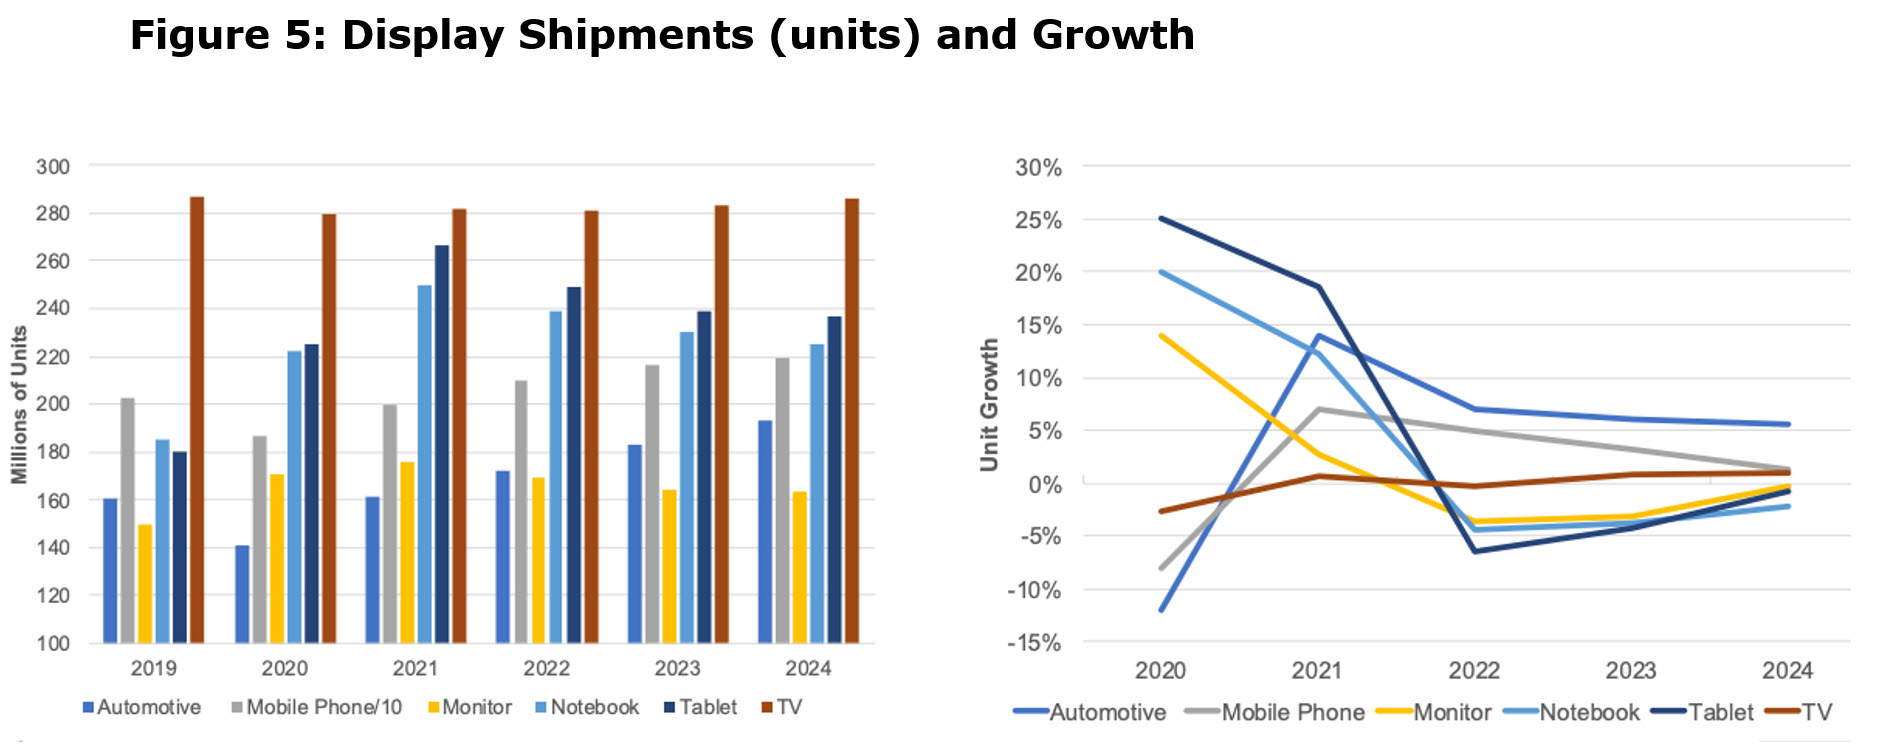
From a shipment volume perspective, the wild fluctuations of 2020 and 2021, when Y/Y growth rates by application are expected to vary from 25% for notebooks to -12% for automotive displays are expected to return to a more normal condition in 2022 to 2024, when growth will moderate between +10% and -5% depending on the application.
 Source: DSCC
Notebook and tablets are driving LCD demand and ASPs as they were both up. Since notebook panel’ price/m2, is significantly higher than TVs, production was shifted to notebooks creating a scarcity in TV panels and a subsequent rise in ASP. Notebook and tablet shipments are expected to increase in 2021 but more modestly. Since TV OLED shipments are growing and overall TV shipments are falling slightly, OLEDs are gaining minimally in market share.
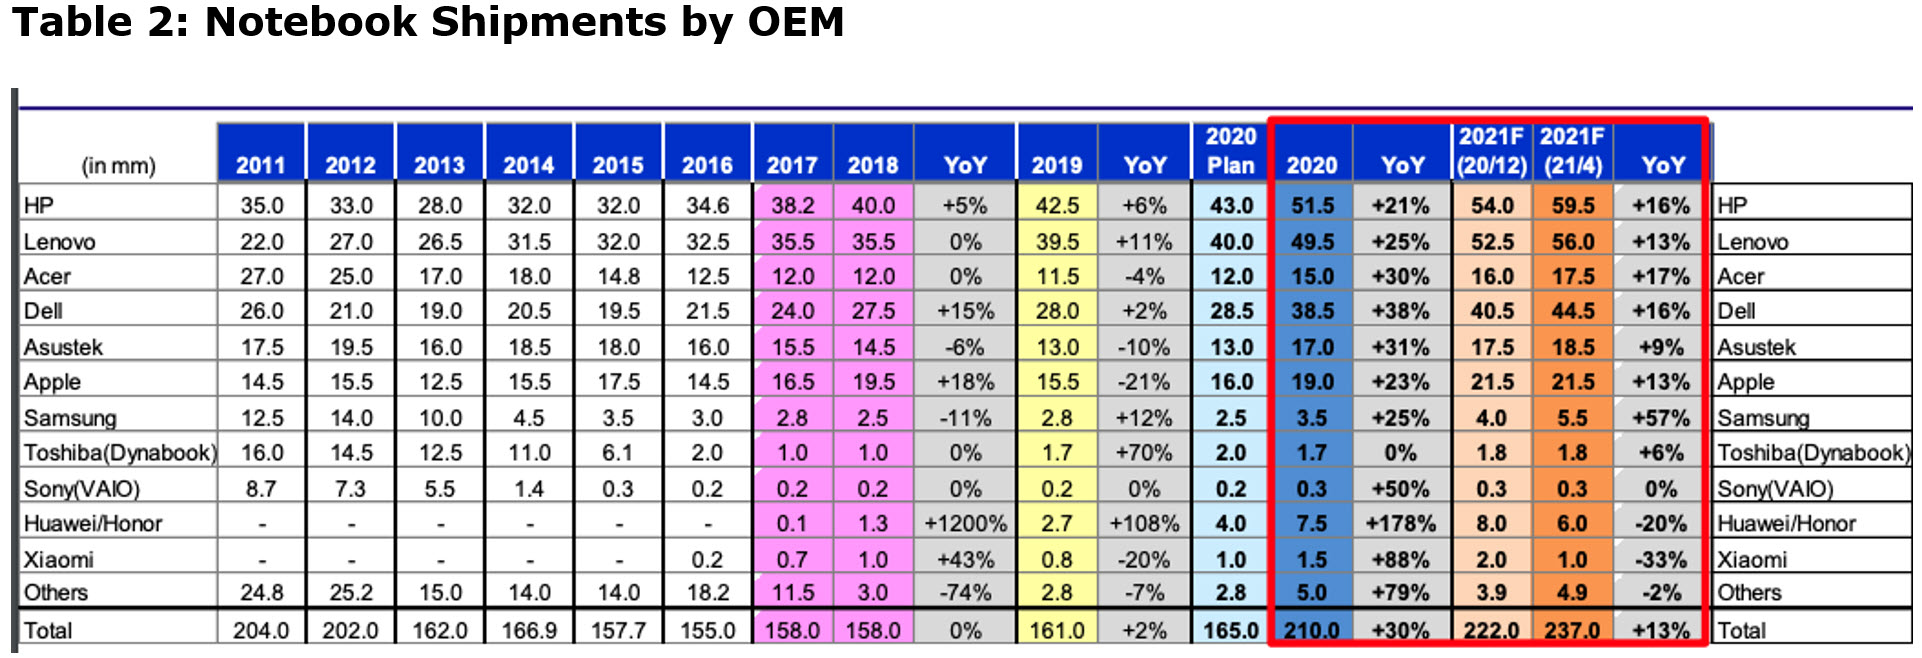
Over the last five years, the notebook market has been very stable, with the top 5 OEMs being HP, Lenovo, Dell, Apple and ASUS. HP and Lenovo are very close so they have been swapping leadership position and Apple will gain or lose market share based on popularity of their latest product release.
 Source: Mizhuo Securities
 Source: Mizhuo Securities
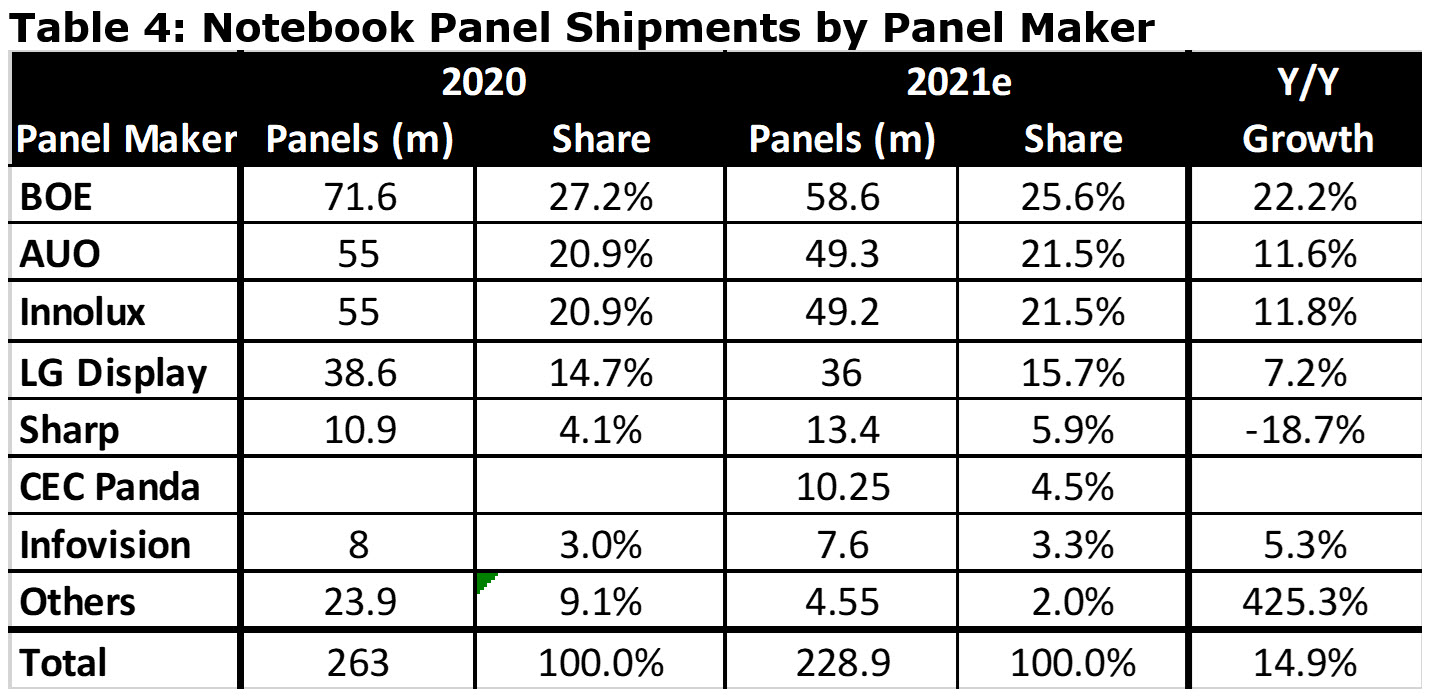
Notebook panel suppliers had 20% Y/Y gains as the notebooks and tablets surged up 30% and 10% respectively. In 2021, panel volume is forecast to be up 15% Y/Y with BOE, AUO and Innolux up by double digits.
 Source: Mizhuo Securities
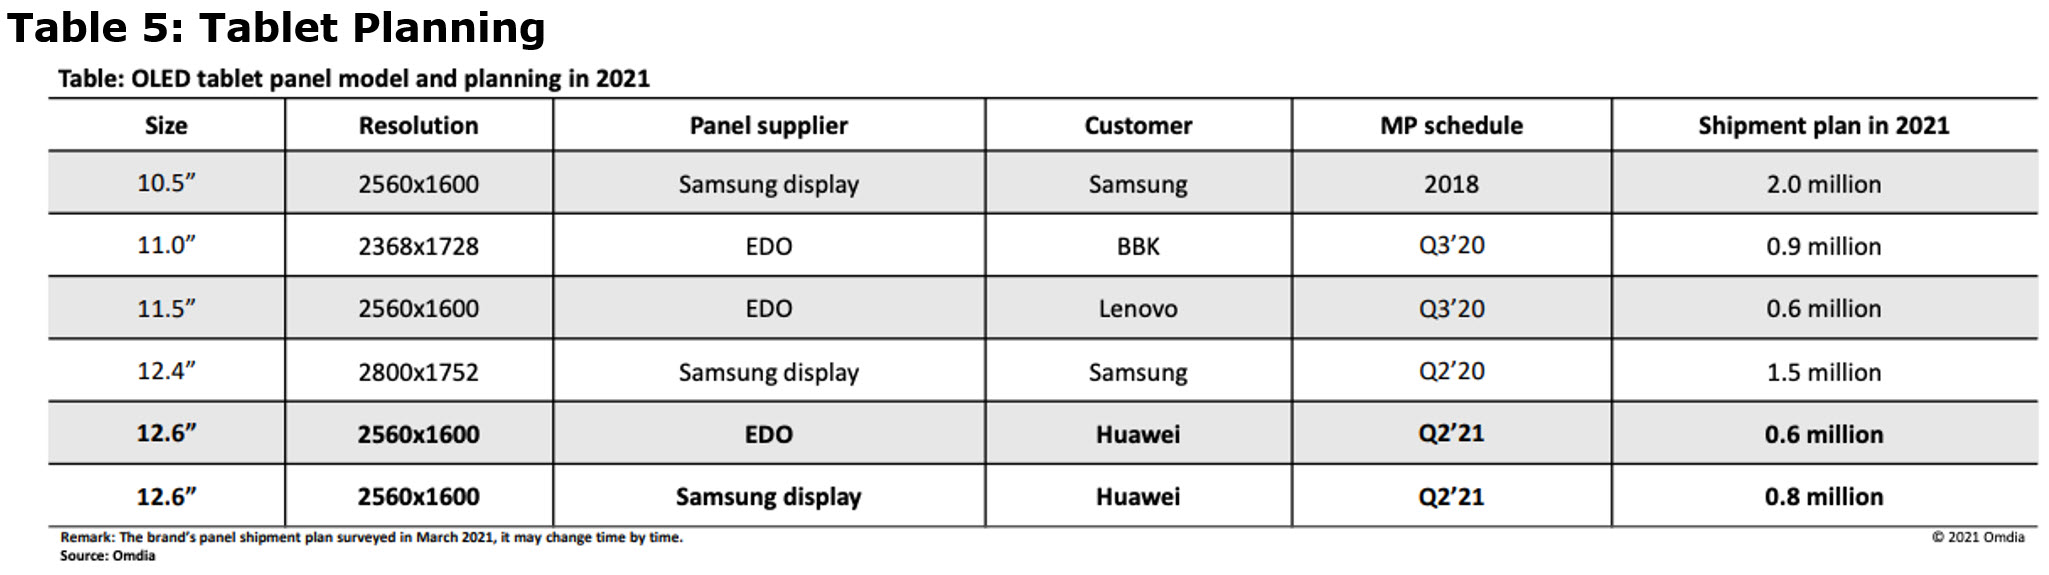
OLED panels for the category are expected to be under 5m, but with Samsung dedicating an entire line to the mid-range and the expected performance increases, 2022 could reach 10m units.
 Source: Omdia
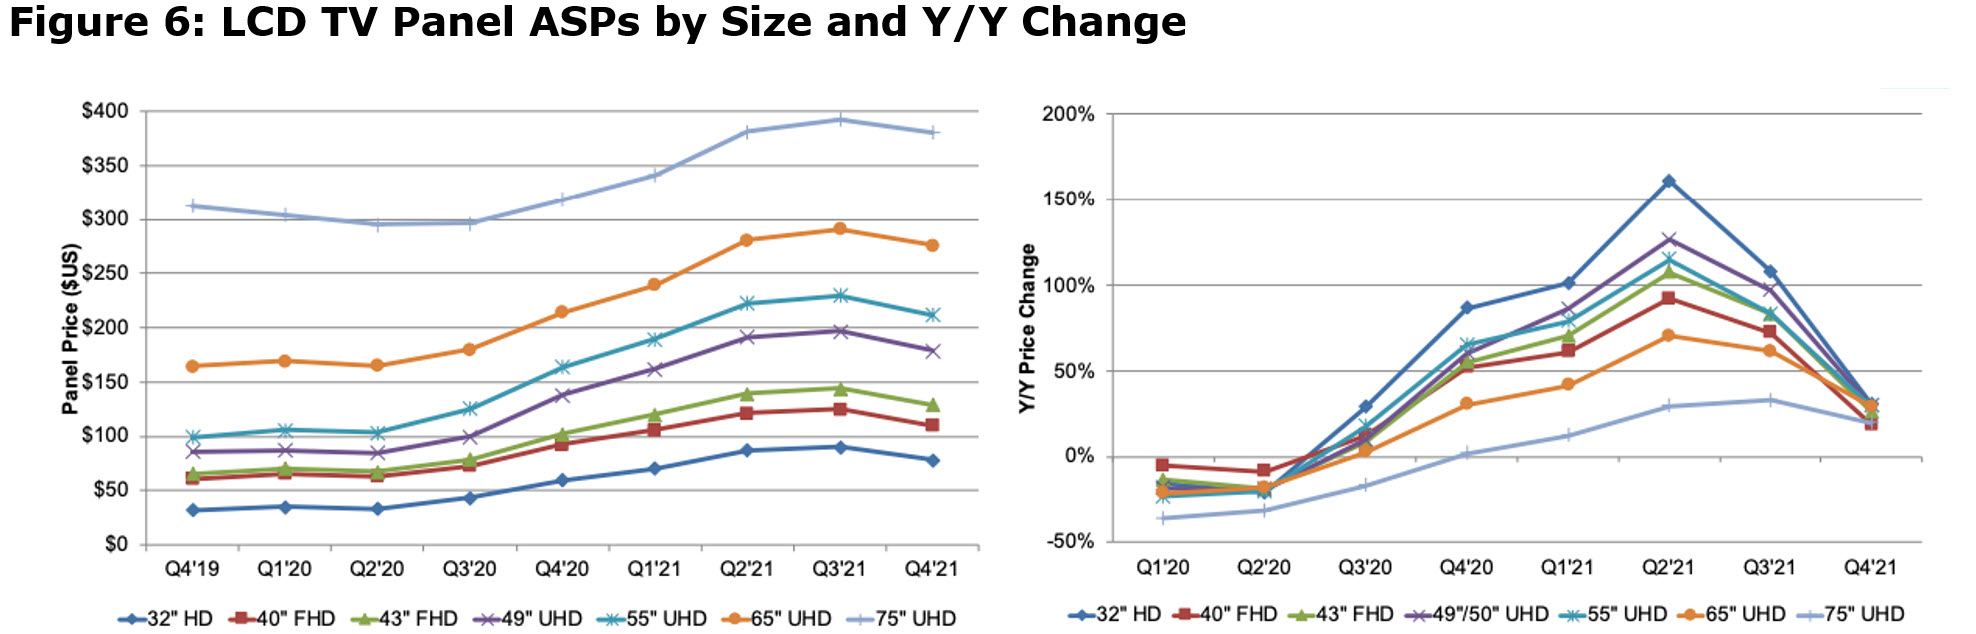
Despite the growth in TV panel area, the number of units is expected to remain flat, and the trend of rising TV panel ASPs is expected to end between Q321 and Q421 as more capacity enters the market. The past 1½ years have been unprecedented in the industry as the typical 10% average price drop Y/Y was reversed as shown in the next figure. Prices rose as much as 150% Y/Y (75”). Even by Q421, DSCC doesn’t expect prices to start retreating just the Y/Y growth. The increase in TV panel prices is good news for LG Display on two levels:
-
Profit margins are up because of the increased ASP for LCDs. 55” and 65” OLED panel prices are close to parity with LCDs when the backlight is added to the panel.
-
At the high end, miniLED TVs have comparable prices to OLED TVs, which has caused LG to change its pricing strategy from consistent decreases in panel prices to small increases.
As OLED TV panel profit margins increase, it is likely to encourage other panel makers to speed up their OLED investments to take advantage of the higher panel prices. DSCC forecast that LCD prices will continue rising throughout 2021, although the percentage increase is expected to taper beginning in Q321.
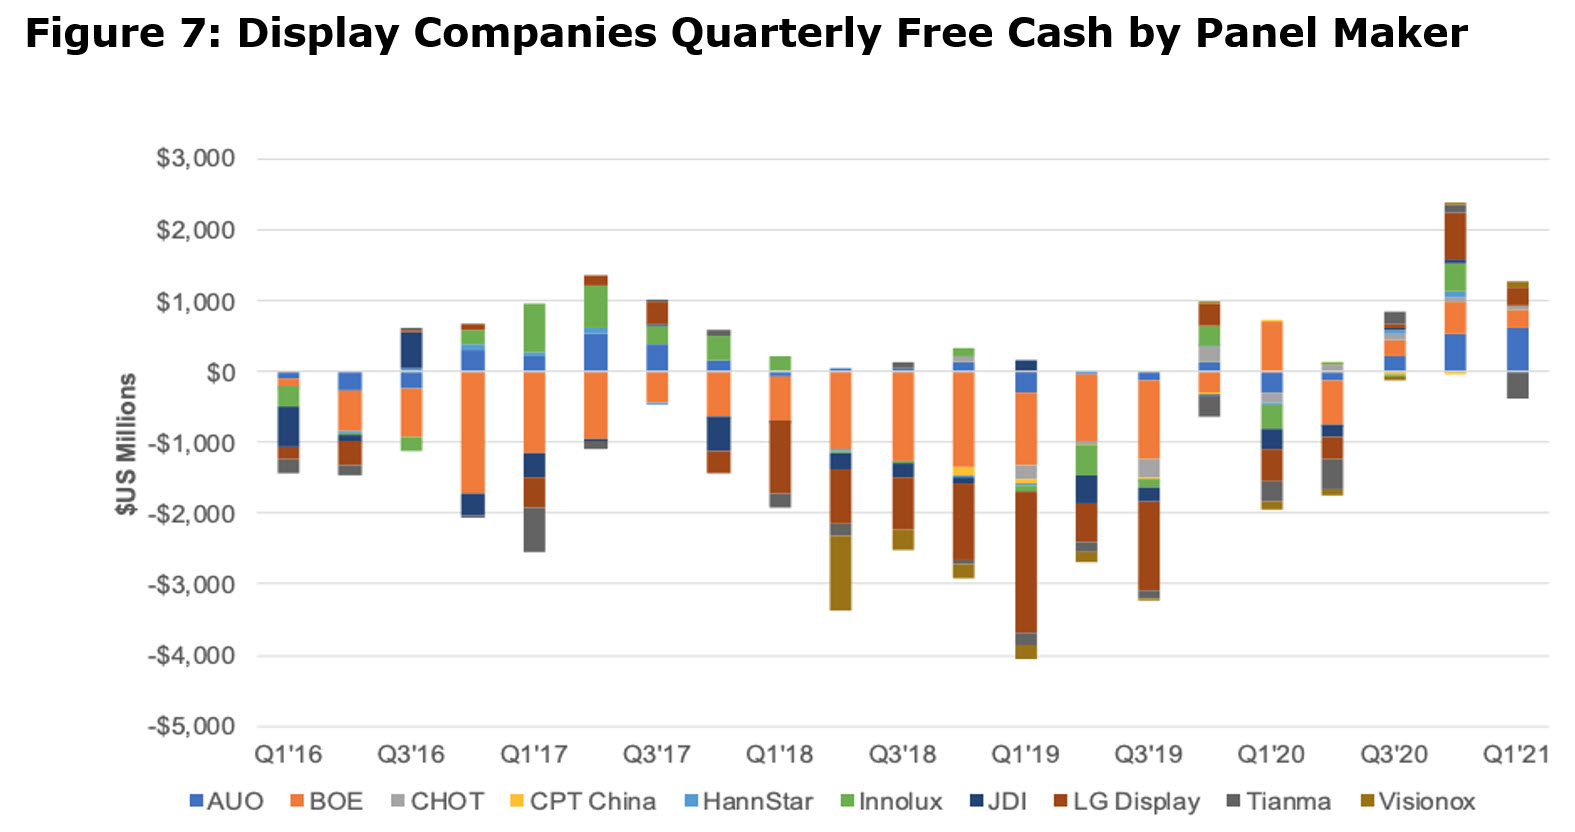
The next chart shows the free cash for all the public display companies, which was cumulatively negative for each quarter from Q116 to Q220. The free cash is actually much worse than the chart shows in that the cash infusion from the Chinese government, which accounts for 75% of the capex for Chinese fabs is not reflected in the free cash calculation. The Chinese government typically invests 75% of the capex and receives a 25% interest in the fab. The good news is that, starting in Q320, the free cash has been positive maxing out in Q420 with $2.4 billion. Since the cost of a new OLED gen 6 fab is over $4 billion, individual panel makers are not able to self-fund a new fab, without resorting to the government, borrowing or accessing the market.
 Source: DSCC
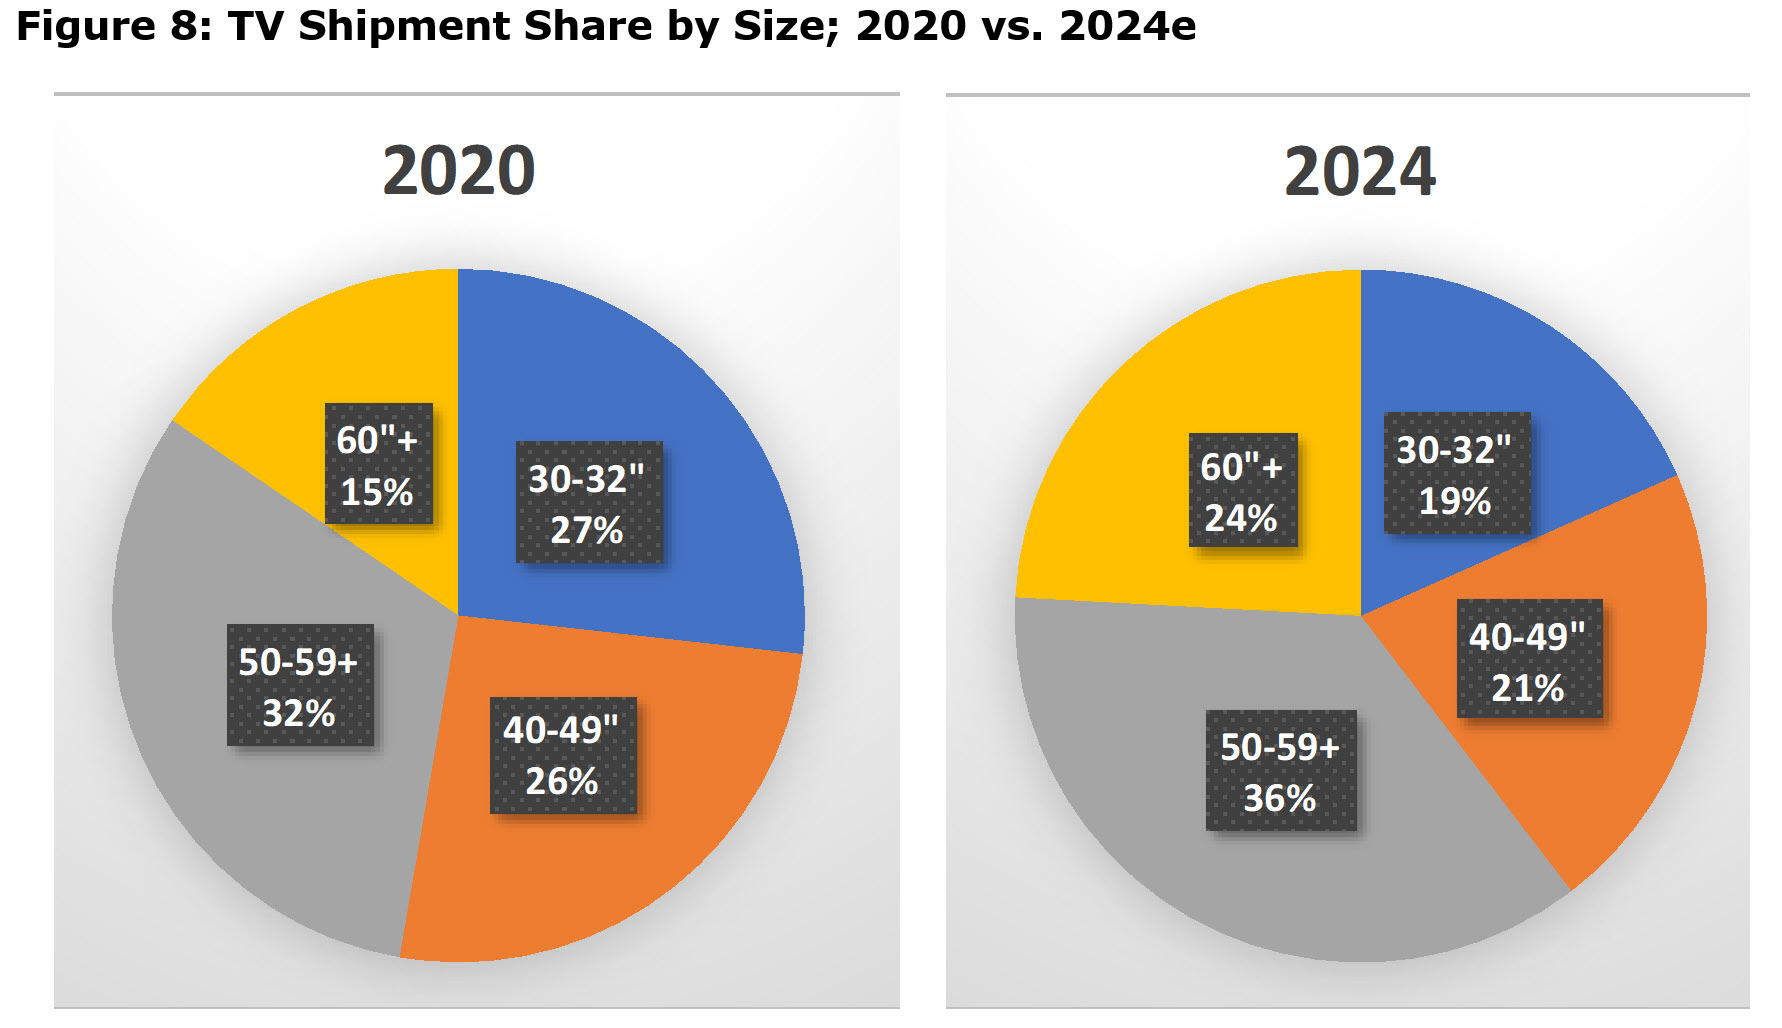
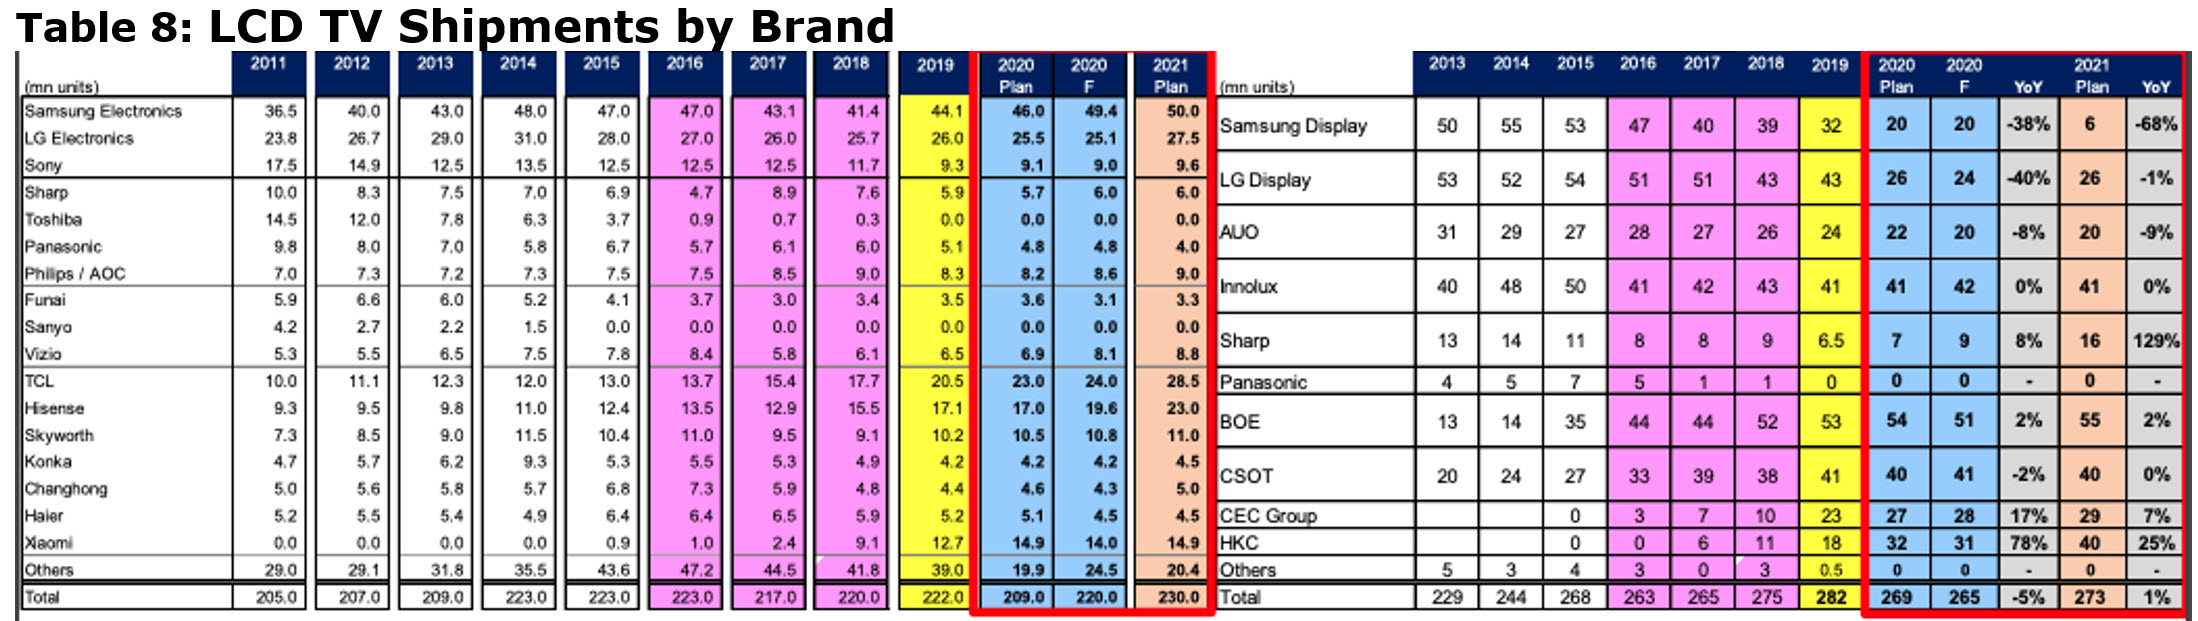
Turning to individual applications, the TV market peaked in 2018 with 223 sets and have been sliding ever since. 2020 shipments were 222m and the market is expected to remain close to that level thru 2024, when it is forecast to be 217m sets. The size make-up is changing as shown in the next set of charts.
 Source: OLED-A
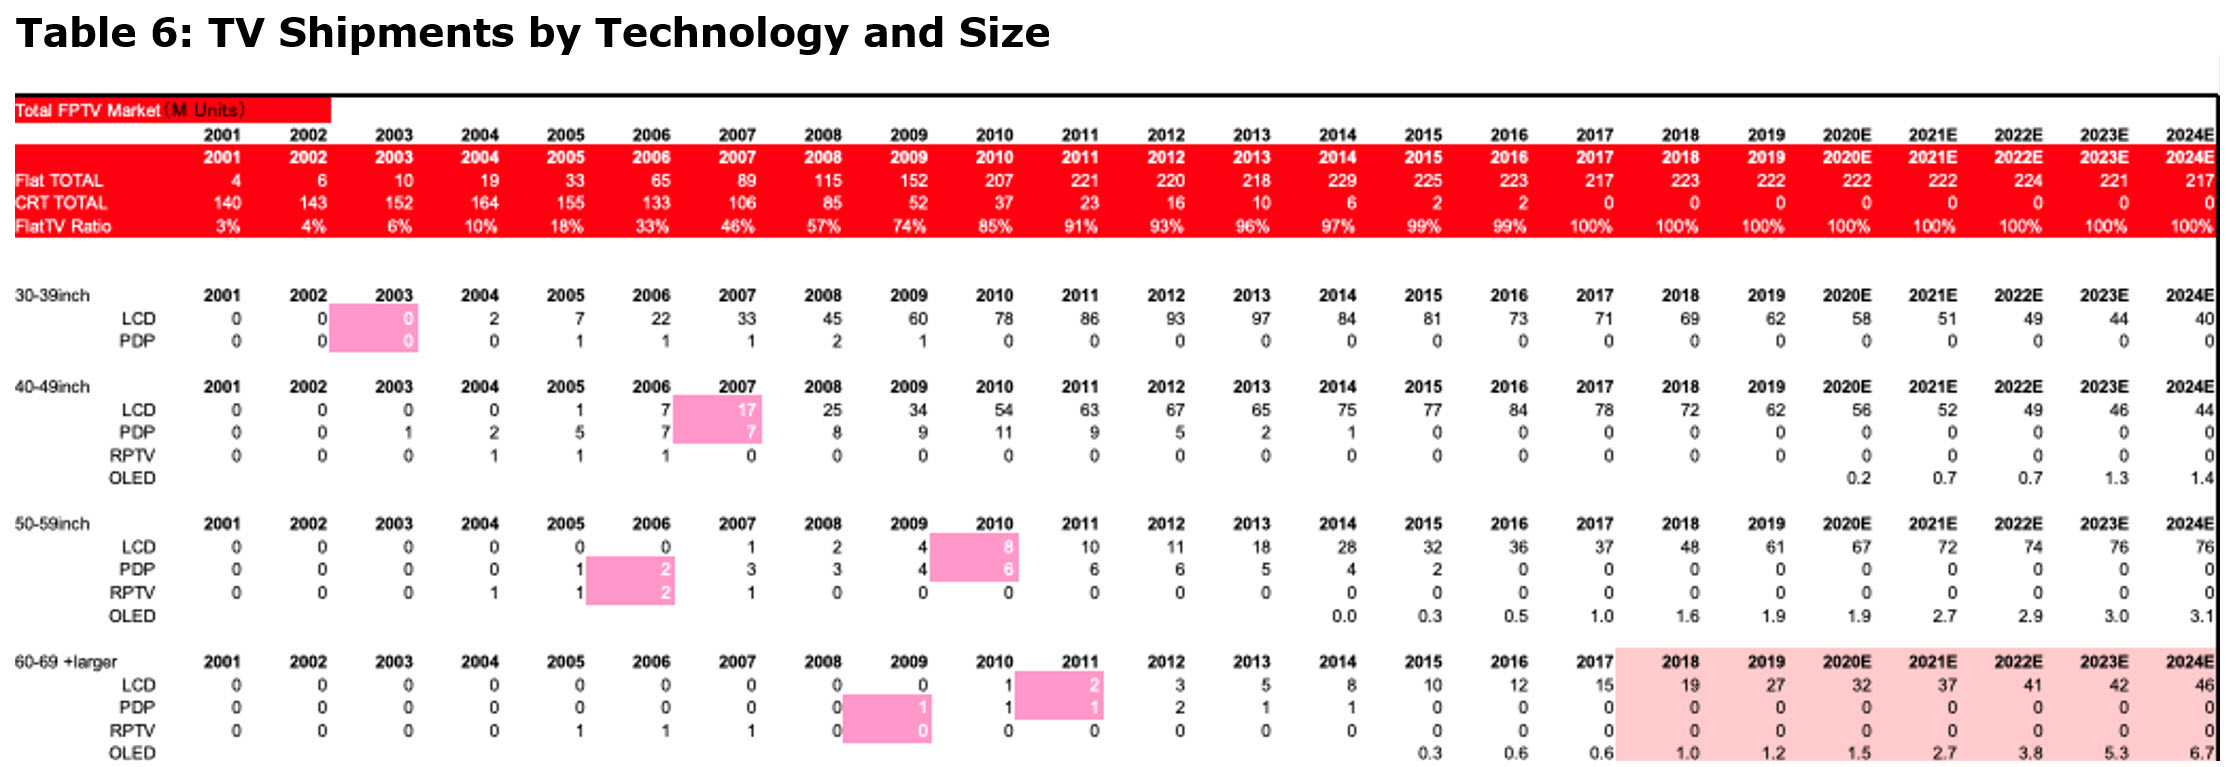
The next table plots the history of TV shipments by size beginning in 2001, when CRTs dominated the category. PDPs had a run between 2003 and 2013,, but then faded quickly. OLED TVs started shipping in 2015 and are expected to reach ~15m units in 2024, less than 10% market share. At that point, however, OLED TV growth could accelerate with new Gen 8.5 fabs from BOE, CSoT, SDC and a Gen 10.5 fab from LGD, which cumulatively could double panel capacity giving OLEDs a 30% share of the lucrative 50” and greater TV market.
 Source: Mizhuo Securities. Click for higher resolution
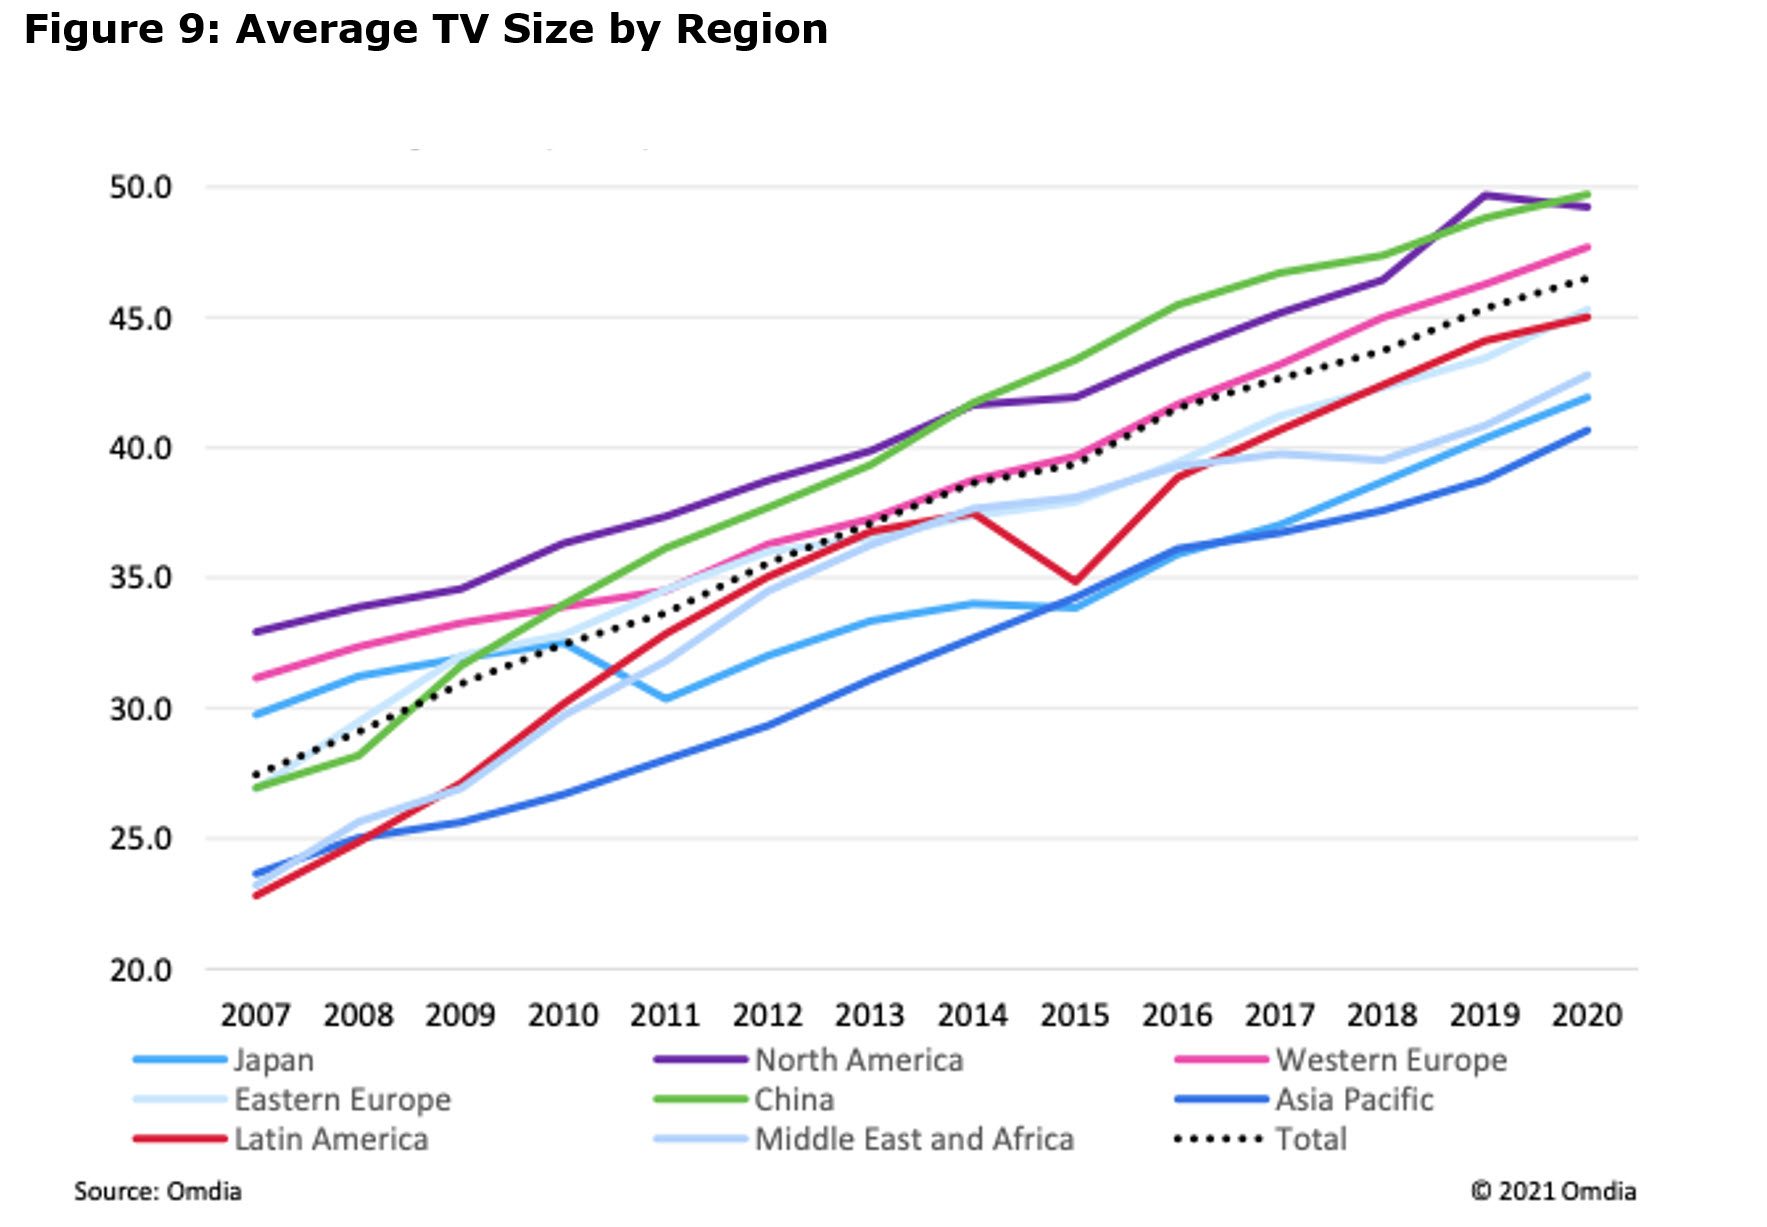
The next figures plot the growth in average TV size by region for the total TV market. The average size of all TVs has grown from ~27” in 2007 to 45” in 2020. By region the average size varies from 50” in China and North America to just over 40” in Asia Pacific.
 Source: Omdia
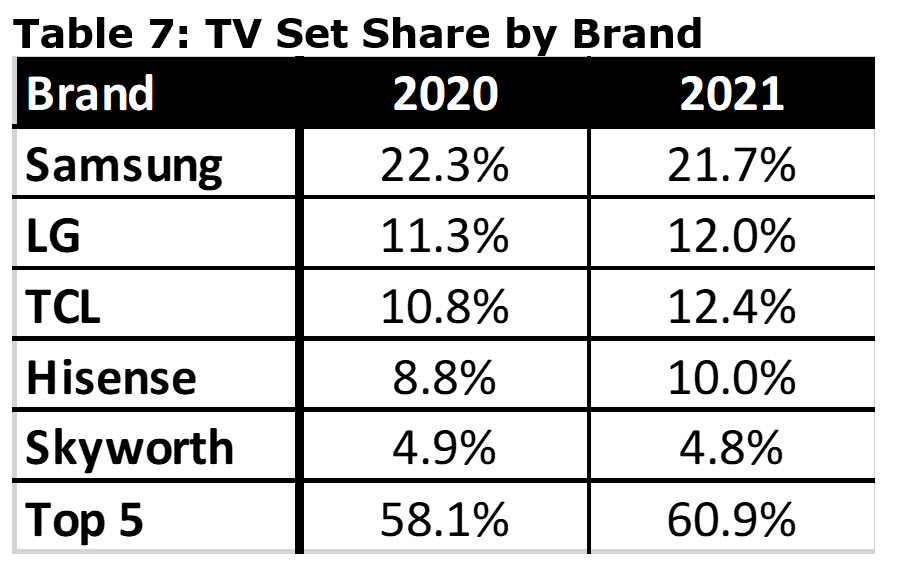
The top five brands and their market shares for TV sets in 2020 and 2021 are shown in the next table. In 2021, TCL is expected to replace LG as the #2 supplier.
 Source: Mizhuo Securities
 Source: Mizhuo Securities Click for higher resolution
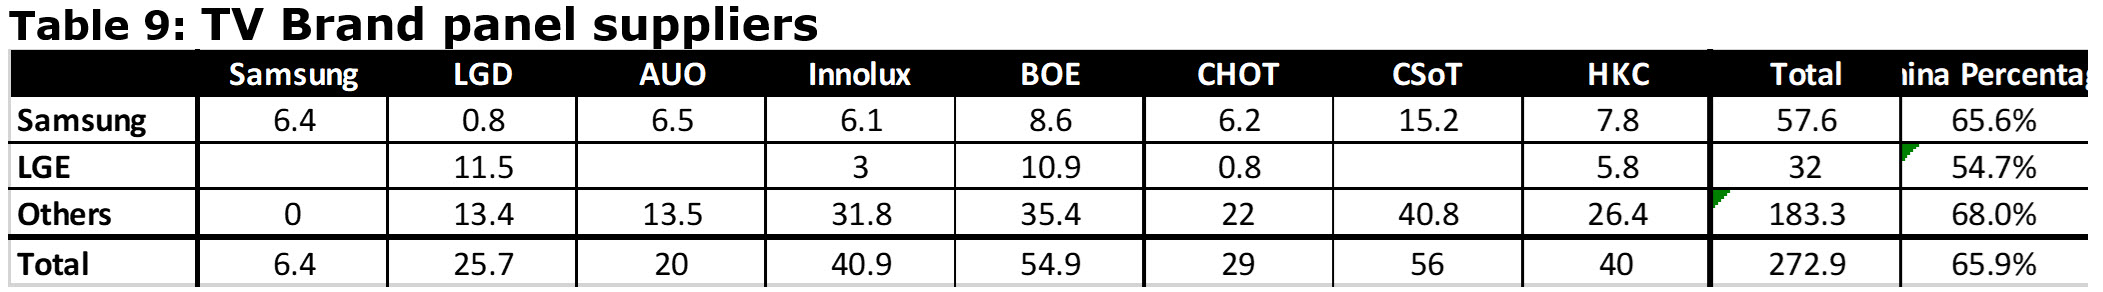
The dilemma for Samsung is that, in 2020, 65% of their panels were sourced from China. In 2022, when panel prices start to return to 2019 levels, there will be pressure on SDC to close down its own Gen 7 and Gen 8 fabs, putting more of the TV business demand to China. Samsung Visual is now considering alternatives, including adopting OLEDs. They are toying with getting two mlllion OLED panels from LGD and then another 1-2m from SDC’s QD-OLED program.
 Source: Mizhuo Securities
Tomorrow, I’ll look in more detail at the competition between different display technologies and the future of technologies including microLED. (BY)
Publishers’ Note: We won’t count tomorrow’s Part 2 as part of your two free articles per month. Parts 1 & 2 will count as a single article.