The first quarter of 2023 saw a significant decrease in worldwide tablet shipments, with a drop of 19.1% compared to the previous year, totaling 30.7 million units. The shipment volume, according to data from the International Data Corporation (IDC), is now comparable to pre-pandemic levels, similar to the 30.1 million units shipped in Q1’19 and 31.6 million in Q1’18.
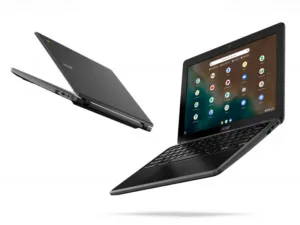
With vendors looking to clear out inventory before launching newer models, the first half of 2023 is projected to follow a similar trend. Chromebook shipments also experienced a contraction in Q1’23 with a 31% decline year over year, reaching a total of 3.8 million units. However, a slight quarterly recovery was noticed towards the end of the quarter as some vendors anticipated a rise in Chrome OS licensing costs in the latter half of 2023.
All top tablet vendors, including Apple and Samsung, recorded a decline in the first quarter, accounting for 58% of the total tablet market. Despite the decline, Huawei managed to climb the ranks to secure the third position, even though their shipments declined by 9.7% year over year. Lenovo and Amazon, ranking fourth and fifth respectively, also faced decreased volume due to weakening demand.
The global economic recovery, coupled with easing inflation, may potentially bring about improvements in shipments in the second half of 2023. The recent launch of OnePlus and the upcoming Pixel Tablet from Google suggest a growing interest from the supply side, despite the overall decline in tablet shipments.
The data below provide a clearer picture of the tablet and Chromebook shipments for Q1’23:
Tablet Shipments Q1’23
| Company | Q1’23 Unit Shipments (millions) | Q1’23 Market Share | YoY Growth |
|---|---|---|---|
| Apple | 10.8 | 35.2% | -10.2% |
| Samsung | 7.1 | 23.1% | -14.3% |
| Huawei | 2.0 | 6.6% | -9.7% |
| Lenovo | 1.9 | 6.2% | -37.1% |
| Amazon | 1.4 | 4.6% | -62.0% |
| Others | 7.5 | 24.4% | -13.8% |
| Total | 30.7 | 100.0% | -19.1% |
Chromebook Shipments Q1 2023
| Company | Q1’23 Unit Shipments (millions) | Q1’23 Market Share | YoY Growth |
|---|---|---|---|
| HP Inc. | 1.1 | 27.8% | 35.5% |
| Lenovo | 0.8 | 21.3% | -41.6% |
| Acer Group | 0.8 | 21.2% | -27.1% |
| Dell Technologies | 0.5 | 12.9% | -57.9% |
| Samsung | 0.3 | 7.8% | -11.4 |

