Despite intense economic hardship related to COVID-19 quarantine orders, consumer and commercial customers went on a tablet buying spree to support work/learn-from-home initiatives. The supply chain almost fully recovered by April/May, which contributed to a 17% year-on-year increase in tablet shipments in Q2 2020, according to Strategy Analytics’ latest report.
Back-to-school demand could further boost the tablet market in the fall and looking long-term, tablet sales could see an extended resurgence due to lower price points if remote work and school options remain post-pandemic.
The full report from Strategy Analytics’ Connected Computing Devices (CCD) service, Preliminary Global Tablet Shipments and Market Share: Q2 2020 Results can be found here.
Eric Smith, Director – Connected Computing said, “As COVID-19 is still uncontained in some of the largest markets in the world and research shows certain workers and companies are getting used to remote work, it’s safe to say this won’t be a temporary change in demand. Tablets have evolved from the simple entertainment slate of the boom years into devices more capable of handling work and school tasks, which has broadened the choices consumers and commercial clients face when upgrading or buying new devices for the new normal.”
Chirag Upadhyay, Senior Research Analyst added, “New products played an important part in this quarter’s tablet success as well. Apple’s newest iPad Pro models sold very well as consumers needed devices with keyboards to get work done at home. Microsoft’s fresh Surface Pro, Surface Book, and Surface Go devices gave it an advantage over competitors in the Windows Detachable segment, which have been more focused on updating their notebooks during the commercial refresh. Amazon released the next generation of Fire HD 8 tablets in the middle of the quarter to great success, taking advantage of a captive audience in online retail while brick-and-mortar retail traffic ground to a halt.”
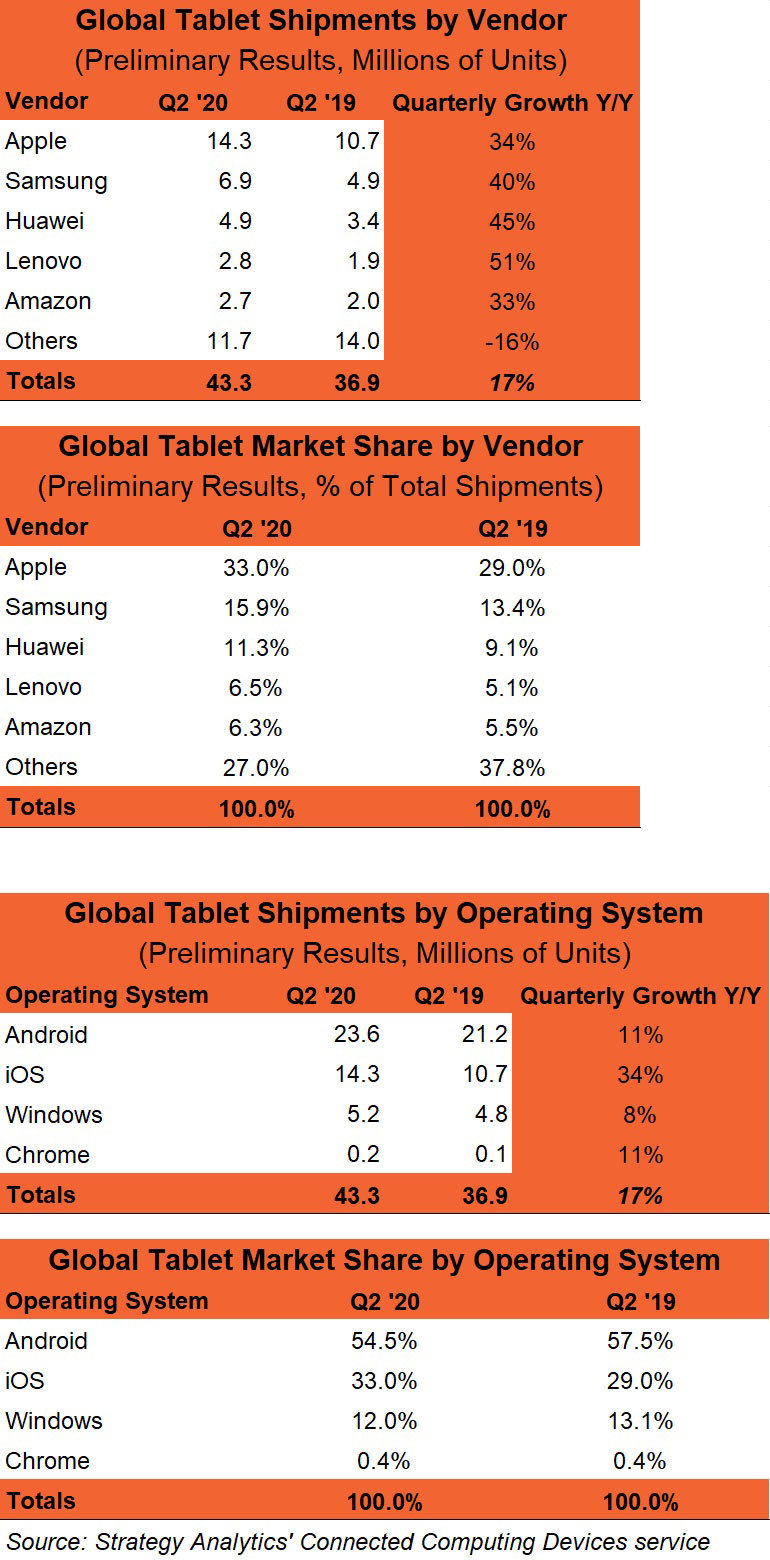
Major Tablet Vendors Consolidated 73% of Global Market Share1
|
Global Tablet Shipments by Vendor |
||||
|
Vendor |
Q2 ’20 |
Q2 ’19 |
Quarterly Growth Y/Y |
|
|
Apple |
14.3 |
10.7 |
34% |
|
|
Samsung |
6.9 |
4.9 |
40% |
|
|
Huawei |
4.9 |
3.4 |
45% |
|
|
Lenovo |
2.8 |
1.9 |
51% |
|
|
Amazon |
2.7 |
2.0 |
33% |
|
|
Others |
11.7 |
14.0 |
-16% |
|
|
Totals |
43.3 |
36.9 |
17% |
|
|
Global Tablet Market Share by Vendor |
||||
|
Vendor |
Q2 ’20 |
Q2 ’19 |
||
|
Apple |
33.0% |
29.0% |
||
|
Samsung |
15.9% |
13.4% |
||
|
Huawei |
11.3% |
9.1% |
||
|
Lenovo |
6.5% |
5.1% |
||
|
Amazon |
6.3% |
5.5% |
||
|
Others |
27.0% |
37.8% |
||
|
Totals |
100.0% |
100.0% |
||
|
Source: Strategy Analytics’ Connected Computing Devices service |
||||
Android Showed Resilience in Q2 2020, Growing Stronger Than Windows Segment1
|
Global Tablet Shipments by Operating System |
|||||
|
Operating System |
Q2 ’20 |
Q2 ’19 |
Quarterly Growth Y/Y |
||
|
Android |
23.6 |
21.2 |
11% |
||
|
iOS |
14.3 |
10.7 |
34% |
||
|
Windows |
5.2 |
4.8 |
8% |
||
|
Chrome |
0.2 |
0.1 |
11% |
||
|
Totals |
43.3 |
36.9 |
17% |
||
|
Global Tablet Market Share by Operating System |
|||||
|
Operating System |
Q2 ’20 |
Q2 ’19 |
|||
|
Android |
54.5% |
57.5% |
|||
|
iOS |
33.0% |
29.0% |
|||
|
Windows |
12.0% |
13.1% |
|||
|
Chrome |
0.4% |
0.4% |
|||
|
Totals |
100.0% |
100.0% |
|||
|
Source: Strategy Analytics’ Connected Computing Devices service |
|||||
1 All figures are rounded