
As a QD expert I can’t help but think A LOT about color gamut. And frequent readers know how important this is in display technology these days. While there have been updates to the recommendations regarding quantifying color gamut (now the preferred metric is color volume), sometimes the simpler approach is useful to make a point. That’s what I hope to do here with the old fashioned 2D color gamut.

Samsung shared a graphic about QDs and wide color gamut during the QD Forum last year that I highlighted in my summary of the event here. I’ve reproduced the graphic below. In the center we have the BT2020 gamut overlaid on the CIExy chromaticity diagram.
For those of you who are not well-versed in this graphic, essentially it is ideal to maximize the AREA covered by the triangle. Bigger triangle means more possible colors a display can produce. More color means an improved viewing experience and also brightness (or perceived brightness at least which is ultimately what matters). Blue colors reside on the lower left corner of the triangle, red on the right, and green at the top. Displays generate color (or at least trick our brain into seeing color) using mixing of red, green, and blue primaries (the corners).
You can start to see how this triangle can be an important metric in the world of displays. The triangle represents the BT2020 color gamut target (and a lofty one at that). Currently there are no commercial displays that I know of that capable of full BT2020 coverage (other than exotic pure laser projectors – editor). They all fall short, some by a lot.
Now that your primer of the CIE diagram is out of the way, lets dive into the data Samsung published and how it impacts the development of future QD products.
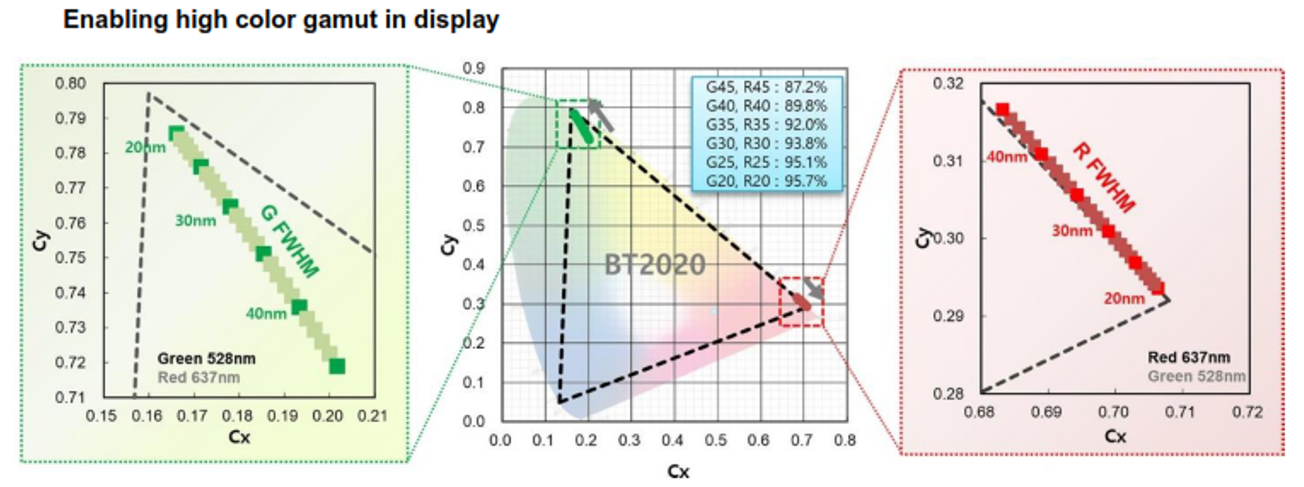 Impact of QD peak width (FWHM – see below) on color gamut at a fixed wavelength. Notice how much more sensitive green is to FWHM compared to red. Only the narrowest of emitters will enable a fully BT2020 gamut. Source: Samsung, https://pubs.acs.org/doi/10.1021/acsenergylett.9b02851
On the left side is a zoom-in of the green color point, on the right side, red. Samsung performed modeling using a theoretical gaussian emitter for green and red (similar to what a QD would do) combined with a theoretical blue emitter (455 nm peak, 20nm FWHM) as a stand-in for a blue LED. For those of you who are not familiar with the acronym “FWHM” it means “Full Width at Half Maximum.” This is the width of a peak at half of the maximum peak height. A broad emitter might be >50 nm FWHM, while a narrow emitter is more likely to be <40 nm FWHM.
In the modeling done by Samsung they artificially adjusted the FWHM of the QD emitter to see how it impacted the color point. In both cases, green and red, the narrower the FWHM, the closer the data point gets to the corners (generally speaking, this is good). Simply put, narrower emitters get you wider color gamut. Hence the marching trend in the QD industry to go narrow, narrower, narrowest!
One caveat to be aware of is that this modeling did NOT account for color filters so it is not likely to be representative of what a LCD would be able to produce in real life since color filters and liquid crystals are imperfect. But the trends are still valid.
So how narrow is realistic for a QD or other emitters? Samsung uses only Cd-free QDs in their products, meaning their QDs are based on InP materials. There has been steady progress in FWHM in the past decade as can be seen in the graphic below. FWHM is currently at 35-40 nm. Also captured here in gray is the PLQY (photoluminescent quantum yield) which is directly related to brightness/efficiency. Higher is better of course. You may notice that the progress has been stalled in the past few years. I don’t believe this is a Covid effect, I think the low-hanging fruit has been picked dry, and further improvements in InP optical performance will be slower than molasses. Maybe even as slow as the pitch drop experiment.
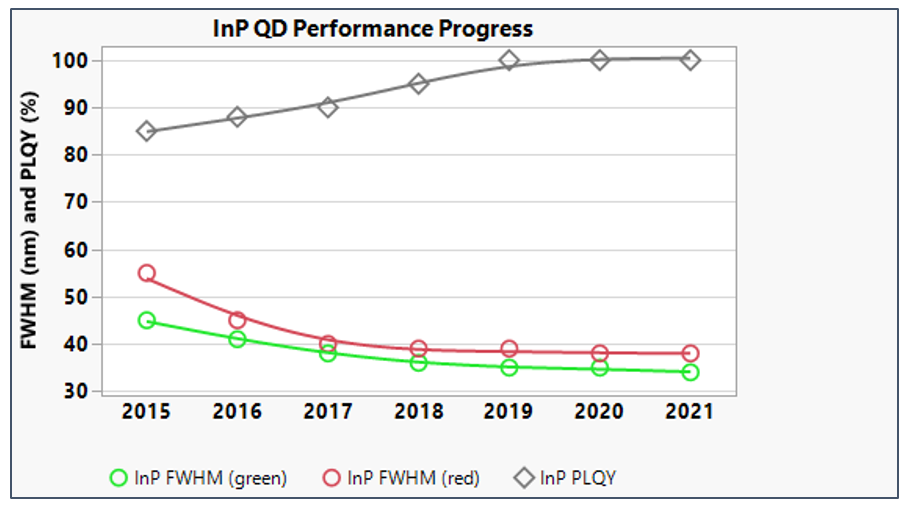 Summary of the progress in PLQY and FWHM for green and red InP QDs since 2015. Data from multiple published sources and presentations at industry conferences
I also took the liberty of plotting the data that is found in the table of the Samsung figure which describes the percent coverage of BT2020 when using green and red QDs with a particular FWHM. As you can see, there are diminishing returns as the FWHM decreases. A FWHM <20 may not even be realistic, but even if it were, there wouldn’t be much of a reason to push further towards a laser line, at least in terms of improving gamut.
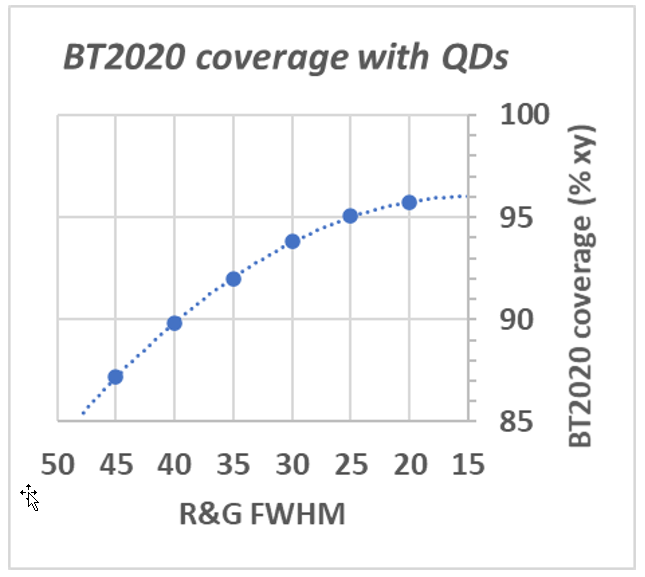 Diminishing returns when reaching ultra-narrow QD emission. Decreasing red and green FWHM provides wider gamut, but there becomes a point where it’s no longer worth the effort.
Of course, InP QDs are not the only emitter in town. Competition from phosphors (especially KSF red) and other material types (CdSe, perovskite) make this a complex landscape when it comes to the best materials.
In summary, it’s becoming exceedingly difficult to make more narrow Cd-free QD emitters, and the return on investment (at least in terms of gamut) is also lower and lower as we go more narrow. So for now QD developers are focusing on improving stability, decreasing cost, and getting the tech into more and more displays. (PP)
(The other issue with this trend is metamerism. Humans see colour differently when very narrow primaries are used to create images – Editor) See Does WCG Make More People Colour Blind? and RGB is Not Enough for Virtual Production
Peter Palomaki is the owner and chief scientist at Palomaki Consulting, a firm specializing in helping companies solve big problems at the nanoscale. His utilizes his expertise in quantum dots and materials chemistry to solve challenging problems with clients large and small.