
Samsung’s new QD-OLED TVs have been touted by reviewers as delivering a brighter picture with a wider color gamut than comparable WOLED TVs. And while the S95B (55” TV) isn’t as bright as some of the brightest LCD/LED TVs, it’s the brightest OLED to date, and its color reproduction is extremely good. But the differences between the WOLED Eco and the QD-OLED are not as significant as flaunted.

The next table shows selective measurements of the QD-OLED, WOLED and a MiniLED with QD enhancement. While OLEDs are less bright than the best LCDs, which often reach over 4,000 nits, most movie content is prepared at 600 nits. However, the high luminance is used for HDR content is ~2,000 nits and is expected to eventually reach 10,000 nits.
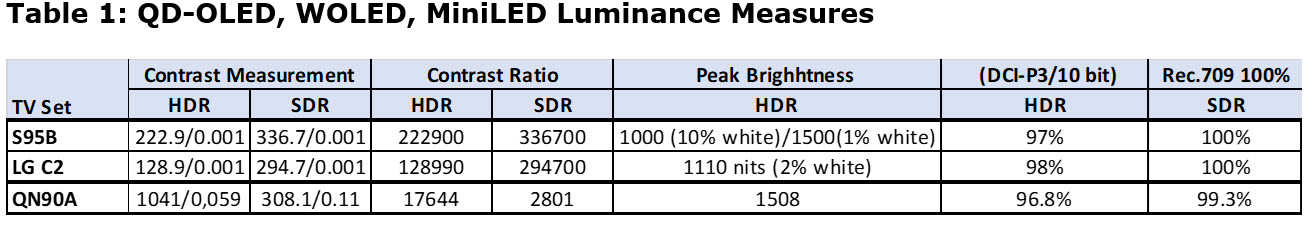
The Samsung Neo was included because it is one of Samsung’s high brightness TVs on the market. Source: Reviewed
OLEDs use Average Picture Level (APL) as a way to protect the lifetime of the TV as aging is related to the level of emitter usage. APL is the percentage of the display that is lit up compared to a full white display, so a display that is completely red, green, or blue would be 33% APL. There are standard settings for stating the specification of an OLED TV, typically 2% or 3% or 10%, but the factor is user selectable. OLEDs also have Automatic Brightness Limiting (ABL) circuitry, which prevents the panel from reaching luminance levels that could damage (age) the device beyond the manufacturer’s specification. No such setting is needed for LCDs and the manner in which ABL works has been criticized by some OLED owners.
In the following analysis of various video content, done by Reviewed, the readings were taken with the S95B’s Picture Clarity settings turned off and Intelligent Mode disabled. In addition, peak brightness was set to High, the Color Tone was set to Warm2, and both Film Mode and Contrast Enhancer were disabled. For SDR tests, the TV’s Gamma was set to 2.2.
Reviewed found that in HDR, the S95B’s full-field brightness is higher than its WOLED competitors, and even more impressive, its specular highlights (small, bright picture elements) are significantly brighter. On a 2% (APL) white window in the TV’s Filmmaker mode, the S95B produced a sustained brightness reading of 1,110 nits, while the LG C2, the very same 2% white window produced a result of around 743 nits. One caveat here is that the S95B’s real scene brightness in SDR is dimmer than the LG C2, so for casual, daytime viewing (like cable TV and most streaming content), the C2 has an edge.
Color gamut is the range of colors that a monitor can display in a given color space (RGB, Adobe RGB, DCI P3, etc.). A monitor’s color volume is the color gamut + luminance (brightness or lightness); or how much of the color gamut it can produce at any given luminance level. QD-OLED TVs levels offer higher peak brightness when displaying the industry-standard 10% white window during testing (around 1100 nits while almost all OLEDs end up within the 700–900 nit range) and the colors are more saturated. OLED “color volume” is a more important aspect than peak brightness in and of itself. (and there’s a great way of showing that in the latest IDMS measurement standard – editor – see You Can’t Describe Colour Volume in 2D. Or Can You?)
QD-OLEDs are capable of displaying a significantly larger percentage of the BT.2020 color space. In practice this means that a QD-OLED TV has a wider range of colors to choose from when displaying an image: whereas WOLED TVs have a narrower range, e.g. a specific hue of deep red may not be available because the color palette it works with does not reach that far, so it ‘makes do’ with the closest hue it has at its disposal. A QD-OLED TV may very well be able to display that difficult red hue, resulting in a more convincing, lifelike picture. The offset is the lack of content in BT.2020, which makes the image somewhat artificial, in that it does not represent the cinematographer’s intent. (actually there is quite a bit of content that goes beyond P3 gamut in Blu-ray content – see So, There’s no Colour Content above P3 Gamut, is There? (Part 1) – Editor)
Not as Significant as Samsung Says
In practice, though, the difference is not as significant as Samsung’s marketing would have consumers believe. QD-OLEDs cannot get overly bright without causing issues to the organic material their screens are built around, so they also employ an ABL (automatic brightness limiter) to restrict damage to their panels. Most importantly, they do not get spectacularly brighter when displaying real-world content in the picture modes that they are used the most, i.e. Filmmaker or Cinema: they do look brighter (a 200-nit difference in HDR) as that brightness brings out more detail in shadows and highlights, but it’s not dazzling or recognizable by the typical consumer.
QD-OLEDs cannot get as bright as high end LED/LCD TVs which can reach 1500–2000 nits of brightness, but these levels are of value only in very bright room and for HDR. However, in most cases local dimming tends to mitigate the value of high brightness in 1% viewing areas where the benefits of HDR are most extensive. The contrast on QD-OLEDs suffers in very high ambient environments causing “black images to turn gray when hit by light diluting the monitors contrast and colors. The QD-OLED is designed without a circular polarizer or a color filter but instead uses an anti-reflection film, causing the black to turn gray as reflected light enter the QD converters. Ambient light is also reflected off the metal cathode and can flow thru the blue sub-pixel (w/o a QD) as white light, also contributing to the grayish black. This assessment was done on a QD-OLED Monitor, but the QD OLED TV panel has the same panel structure. (You can show this by shining a bright light on the screen in dark images and I tried it at Display Week using an LED torch app on my smartphone, but for the effect to be obvious, you have to be quite bright and close – editor)
The LG C2 TV is bright enough to overcome glare in bright rooms, but large bright scenes are dimmed considerably by the TV’s Automatic Brightness Limiter (ABL). This isn’t very noticeable with most regular content, but it’s distracting when watching some sports, like Hockey. Setting Peak Brightness to ‘Off’ reduces the aggressiveness of the ABL feature, but also reduces to the peak brightness to about 300 cd/m² in most scenes. These measurements are in the ‘Expert (Dark Space, Night)’ Picture Mode, with OLED Light at ‘Max’, Peak Brightness on ‘High’, and the Color Temp set to ‘Warm 50’. To achieve the brightest image possible, the ‘Vivid’ Picture Mode, with Adjusted Contrast at ‘Max’, Auto Dynamic Contrast on ‘High’ and the Color Temp set to ‘0’ results in a brighter image, reaching a peak of 528 cd/m² with a 2% window.
QD-OLED TVs are way better at expressing primary colors such as red and green because they use quantum dots to make the conversion rather than color filters. The next chart shows the narrow spread of the QD-OLED colors.
Figure 1: QD-OLED — Emission Intensity vs. Color Spread
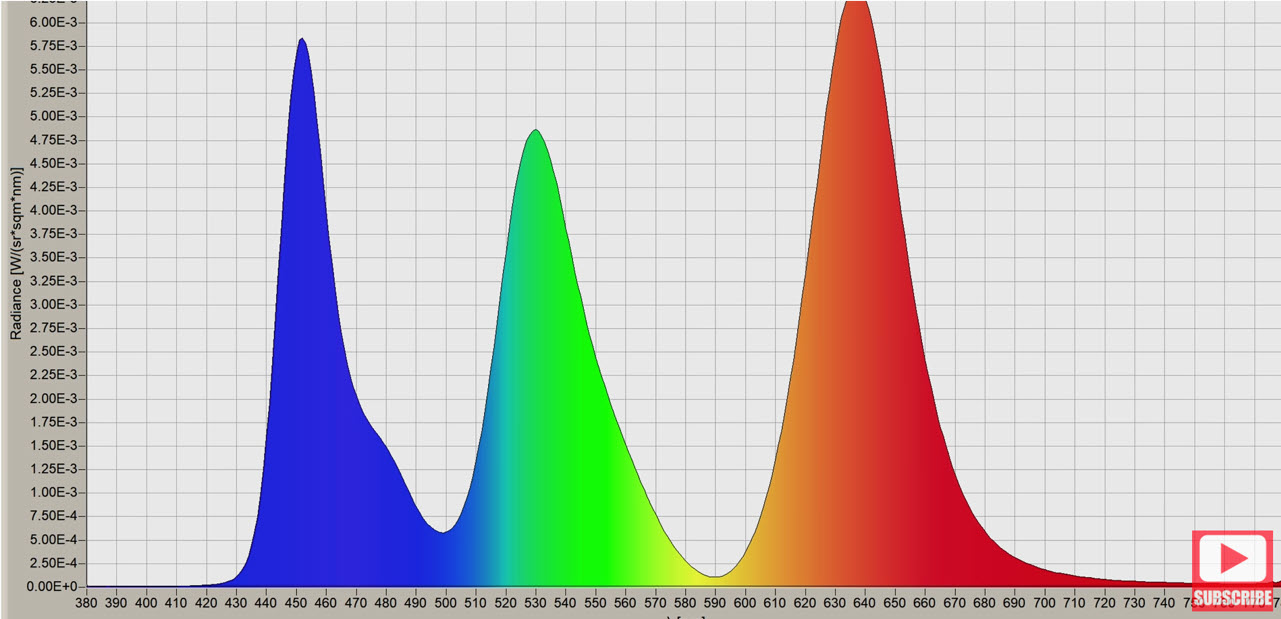
Source: HDTVTest
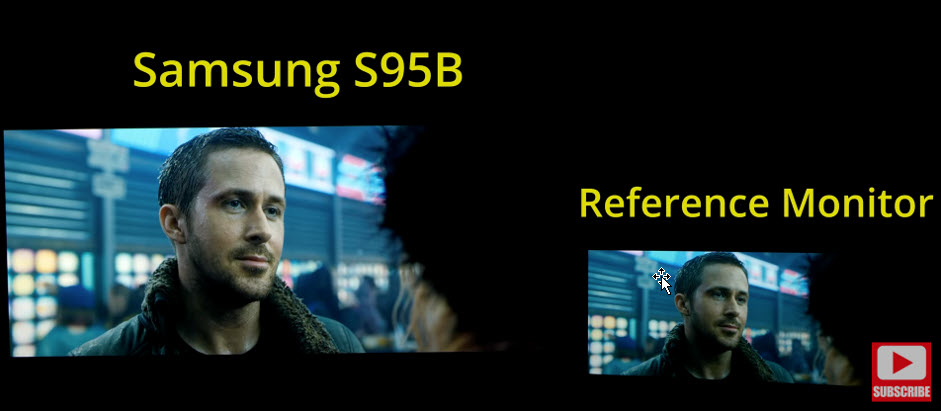
QD OLED has a wider color gamut and higher color accuracy at standard measurement patterns such as APL’s 5%, 10%, and 20%. The firmware seems to be optimized at standard APLs but does not perform as well at non-standard APLs. Samsung tends to use the higher brightness to cause the colors to pop, causing the image to depart from its original color map as shown in the next figure, which compares the S95B with a Canon reference monitor calibrated for 1,000 nits. The next chart compares the black levels of the S95B and the C1 with the reference Canon reference monitor.
(Vincent Teoh of HDTVTest made a detailed test of the set and the inaccurate grey scale here.)
Figure 2: QD-OLED vs. WOLED Image Performance
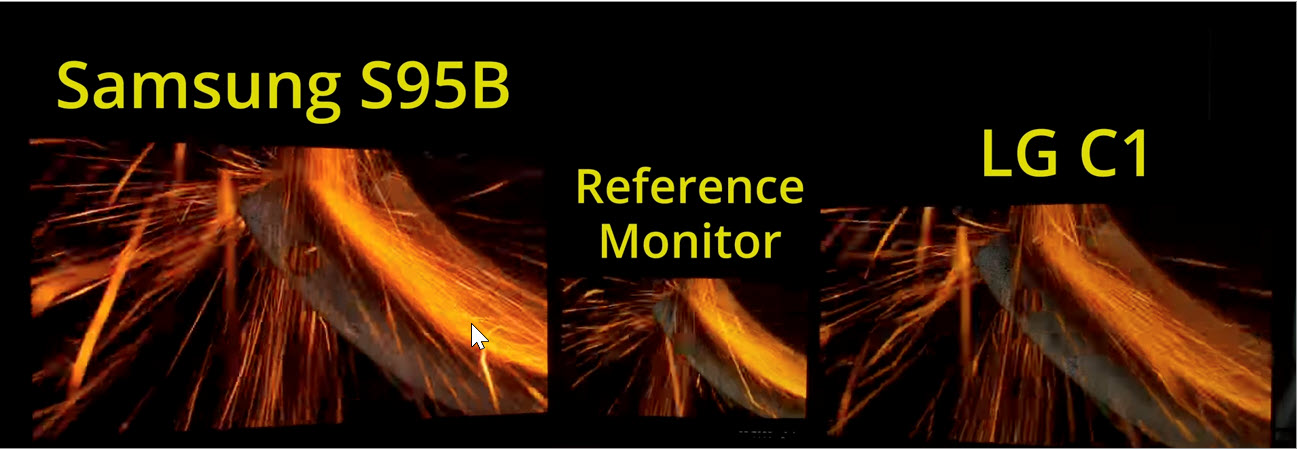
Source: HDTVTest
WOLEDs have become much more resilient to burn-in or more accurately, image sticking over the years and come with several different features designed to minimize the risk, but there’s always the chance of that happening after systematic abuse of the panels — and the same goes for QD-OLEDs. Sony and Panasonic WOLEDs already come with heat sinks and LG is expected to adopt them as well. Samsung Display claims that their TVs use a real-time Image Sticking Correction (ISC) mechanism to monitor and maintain their screens’ pixels, but the long term effect has yet to be demonstrated. The resiliency of Samsung’s approach is likely to be tested by QD-OLED panels used in Alienware’s (Dell) first QD-OLED monitor, which comes with a three-year warranty that includes coverage for image sticking, something no manufacturer had previously offered with OLED screens.
Samsung uses these features to claims that the way these screens work offers a couple of other bonus benefits. Viewing angles of “traditional” OLEDs were already wide enough, for instance, but QD-OLEDs are said to be marginally better in that respect, maintaining brightness and color uniformity to an even higher degree (in a side by side at Display Week this was apparent – Editor). Samsung Display also claims that the panel structure of QD-OLED screens is inherently better at handling reflections, which is a big plus for televisions that struggle with natural light or strong artificial light in any environment. (again obvious at Display Week – editor) The company is quick to point out that QD-OLEDs are also ideal for gaming.
The price of QD-OLEDs is comparable to WOLEDs despite having a cost base that is at least 2x the LGD panel cost. The Samsung S95B QD-OLED TV at 55 or 65 inches is priced the same as an LG G2 OLED TV at the same diagonal. Even the Sony A95K QD-OLED TV, at the same inches, is more expensive than the equivalent Samsung model but no more expensive than what Sony’s flagship OLED model (A90J) used to cost last year. Samsung Display is taking the margin hit to perfect their sales program even though they will be producing only ~500K panels in 2022, compared to LGD’s 8 million panels.
LG Display to Boost OLED Brightness
LG Display has yet to be heard on the differences, but LG Display reportedly will apply micro lenses to OLED TV panels to further boost brightness by an additional 20% to around 1300 nits at a 2% APL. By applying micro lenses to the existing OLED TV panel the light path can be optimized for efficiency, meaning that brightness is increased while overall power consumption is reduced. Micro lenses are already used in some LED LCD panels as well as mobile OLED panels including the one in Samsung’s Galaxy S21 Ultra.
The report cautions that LG Display is still reviewing the technology. If it decides to press forward, the “micro lenses are likely to be applied as early as this year” to mass-production units at one of LG Display’s two current OLED TV factories (Paju, Korea and Guangzhou, China). If mass production of panels starts in late 2022, the new technology may be introduced in LG’s 2023 OLED TVs.
A recent YouTube Video from FOMO compared the Sony A90J, which uses the same panel as the LG C2 with the Samsung S95B. The video selects some extreme cases of color rendition and generally, the S95B’s combination of higher luminance and wider color gamut is superior. But the basis of the color gamut DCI-P3 is often exceeded in the S95B leading some purists to question whether the S95B’s rendition is accurate. Given the variance in eyesight, it is likely to be a personal decision as the differences are only discernable when the images are side-by-side. The figures show the WOLED on the upper left, the QD-OLED on the bottom left and the reference monitor on the bottom right. On the top right are color gamut and luminance measures.
Figure 3: QD-OLED vs. WOLED Image Performance
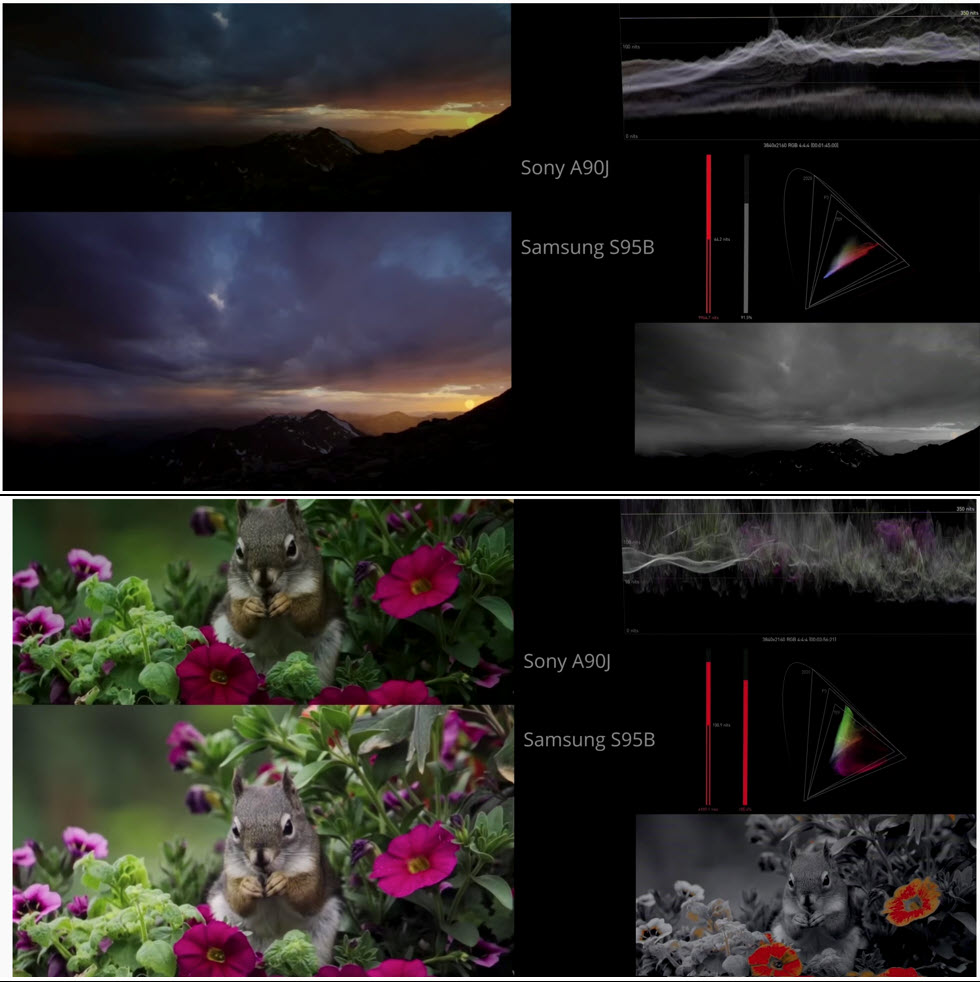
Source: FOMO
Samsung video processors are quite accurate when displaying images for standard APLs, i.e. 2%, 5%, 10%, which are used for calibration and reference monitor comparisons. But when straying from the standard APL, they appear to disregard the standards. The next figure measures the accuracy of the color gamut for 10% and 9% APLs. The10% level tracks the standard closely but at 9% not so much.
Figure 4: QD-OLED Color Gamut Accuracy
10% APL 9% APL
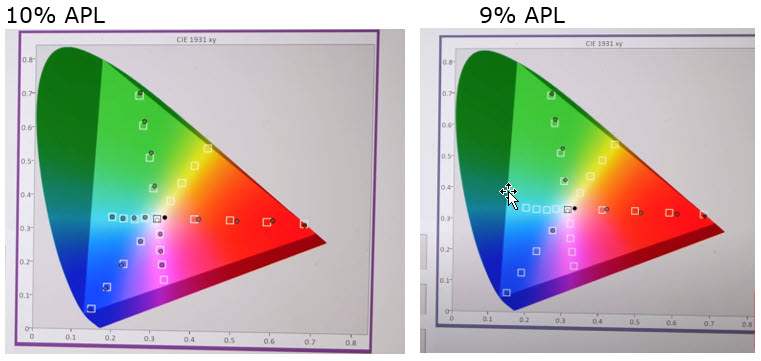
Source: HDTV Test
Figure 5: QD-OLED vs. WOLED Luminance Accuracy
10% APL 9% APL
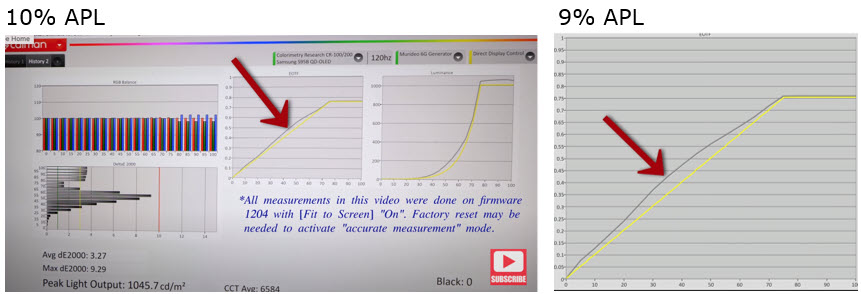
Source: HDTVTest
The same principle applies to luminance, where at 10% the TV tracks the standard, while at 9%, it significantly overshoots the luminance at almost every intensity level. Videophiles are not happy with the results, but for the average user, it makes little difference, and in some cases, the overshoot causes the image to pop even more than intended. LG, if it wanted to violate the standards could offer comparable intensity increases. (BY)
Barry Young is CEO of the OLED Association.
Apologies, an earlier version of this article incorrectly attributed some of the graphics which are from HDTVTest.