In DSCC’s Quarterly Display Supply Chain Financial Health Report, we analyze and compare all publicly traded display equipment suppliers’ financial results and include insights from our Quarterly Display Capex Report where appropriate.
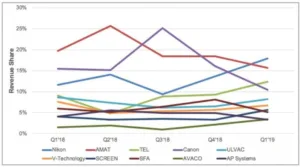
As revealed in the latest issue, Nikon jumped from #3 to #1 in Q1’19 in display equipment supplier revenues on the strength of recognizing six G10.5 litho tools, which are the most expensive tools in TFT backplane fabs by a significant margin. Nikon enjoyed 6% Q/Q and 13% Y/Y growth to $398M in display equipment revenues in Q1’19, while many of its other competitors saw declines. We expect Nikon to lead in litho equipment revenues in 2019 with a 68% to 32% revenue share advantage over Canon in the $2.1B display litho market. Nikon is expected to have an 84% revenue share in LCDs and a 17% share in OLEDs. Litho market share is forecasted out to 2023 in DSCC’s Quarterly Display Capex and Equipment Service.
Quarterly Display Equipment Supplier Market Share for Top 10 Suppliers
?Source: DSCC’s Quarterly Display Supply Chain Financial Health Report
The companies that enjoyed the highest growth in Q1’19 enjoyed at least partial recognition at BOE B11 Phase 3 in Q1’19 with the 3 fastest growing companies consisting of the following BOE B11 Phase 3 suppliers:
- Wonik IPS up 71% on dry etch business
- SCREEN up 40% on coater/developer business
- Viatron up 33% on PI curing business
Looking at operating income for the display equipment divisions and display equipment companies, operating income fell 8% Q/Q and 38% Y/Y to $621M, the lowest since Q4’17. Operating margins were flat at 16%. Nikon led in operating income and operating margins looking at its FPD and Semi litho results even after subtracting its settlement from ASML/Zeiss. In terms of display equipment operating margins, Nikon was followed by Nissin Electric, ULVAC, TEL, Canon and Applied Materials. While no companies had negative operating margins, 10 companies had operating margins of <3%.
Net income fell for the 4th straight quarter, dropping 5% Q/Q and 28% Y/Y to $2.1B. It was the lowest value since Q4’17. Net margins were flat at 11%. TEL had the highest net margins on its strong Q1’ results in Semi and FPD, overtaking Applied, V Technology and SNU. Applied Materials fell to #2 followed by Viatron, Nissin, Jusung and Nikon. Companies seeing double-digit Q/Q increases in net income included Avaco, HB Tech, KC Tech, Invenia, Nikon, Nissin, SCREEN, TEL, TES, ULVAC, Viatron and YAC. Every supplier had positive net income for the first time since Q3’17.
Bookings rebounded in Q1’19 for the 10 companies that reveal this information. Bookings rose 67% Q/Q and should remain strong for the remainder of 2019 on significant growth in 2020 equipment spending. Both LCD and OLED spending should be strong in 2020 with OLED spending coming from LGD and 2nd tier Chinese players and LCD spending coming from Chinese players at both G8.6 and G10.5. The biggest increases came V Technology, Toptec, ULVAC, Jusung and HB Tech. Backlog also increased at HB Tech, Viatron and V Technology with backlog also provided for 10 suppliers.
?Capex, Equipment Spending and Top Supplier Revenues
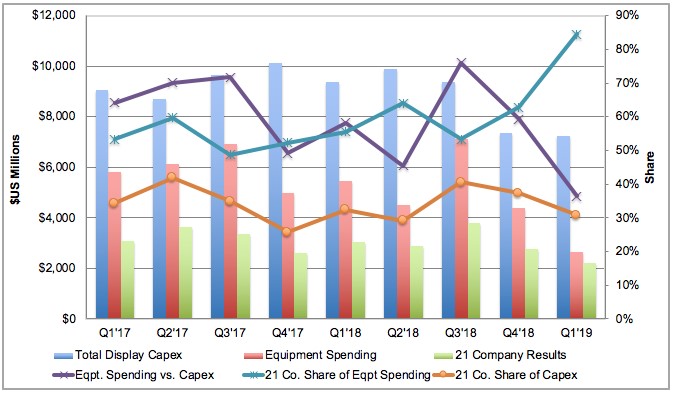 ?Source: DSCC’s Quarterly Display Supply Chain Financial Health Report
Free cash flow rose by over $1B to $1.2B on significant improvements at TEL and Canon which improved their combined free cash flow by $1.35B. Applied Materials maintained the highest free cash flow with Wonik jumping up to #4 and TES #5. Debt/equity ratios remained flat at 21% for the industry. AP Systems, Invenia, YAC and Applied Materials all remained over 50%.
This report also compares the results for the 21 publicly traded display equipment companies vs. total display equipment spending and total display capex. As shown in the first figure, we showed:
- Capex down 2% Q/Q and 23% Y/Y to $7.2B;
- Equipment spending down 40% Q/Q and 52% Y/Y to $2.6B;
- Equipment supplier revenues down 19% Q/Q and 27% Y/Y to $2.22B;
Differences in the growth rates for these figures can be attributed to differences in revenue recognition timing. For example, we believe a number of suppliers recognized some or all of their installations at BOE B11 Phase 3 in Q1’19, while we attributed 100% of those values to Q2’19, creating a high ratio between equipment supplier revenues and our equipment spending estimates in Q2’19. We expect this ratio to dip in Q2’19.
DSCC sees the display equipment market bottoming out in 2019 at $15.2B, down 29%, with impressive growth in 2020 of 36% to $20.7B. 2020 should be a banner year for both LCD and OLED equipment suppliers with OLED spending over $11B and LCD spending over $9B spending. Mobile spending should rebound from a 10% share in 2019 to a 40% share in 2020 with TVs accounting for the remainder.