According to Dictionary.com, “Redux” means “brought back; revived.” I last paid a serious visit to luminance contouring in a 1998 SPIE paper I wrote while at Philips Research titled “Luminance contouring at the display in digital television.”
![]()
Recently, however, one of the other writers for Display Daily asked the question “Can you help me understand something? LCD and OLED displays need 8 or 10 bits per color to cover HD or UHD/HDR content. LED displays need 16- to 20-bits per color to do the same thing. Why? Is it because of the passive vs. active drive scheme? A wider dynamic range?”
Since this was exactly the sort of question my 1998 paper addressed, I passed along a copy of it to answer the question. Only it answered it in terms of 1998 display technologies such as CRT, TN-LCD, LCoS and DLP. When direct view LED videowalls are driven by pulse-width modulation techniques, the contouring problem and the answer are the same as for the DLP system.
Since a problem that bedeviled digital TV researchers in 1998 still troubles display experts 20 years later, Bob Raikes suggested I write a Display Daily article on the topic. Fortunately, I had not only the original paper but the Excel spreadsheets used to do the calculations for the paper and they still ran on my current version of Excel. Thanks, Microsoft!
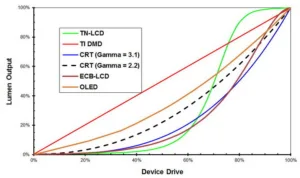
Figure 1: Electro-optical transfer function (EOTF) characteristics of typical display devices. (Credit: M. Brennesholtz)
For this DD, I have updated my 1998 paper slightly. In particular, I’ve added the electro-optical transfer function (EOTF) for two display technologies not considered in the original SPIE paper, ECB-LCD, a LCoS technology under consideration by Philips in 1998 for a consumer RPTV, and OLED. The OLED data is derived from SID 2018 paper 84-1 and I hope it represents typical OLED material. This OLED data I used actually fits a gamma = 1.68 curve quite closely. Of all the OLED papers presented in the 13 OLED sessions at SID, the data in this paper was chosen because it was the easiest to digitize and convert it to the format I needed. Direct view LED was not added to this graph because, as I already mentioned, if the LED display is pulse width driven, its EOTF is identical to the DLP curve in Figure 1.
Note that the EOTF that is important in the question of luminance contouring due to driving the display with too few bits is the EOTF of the display. The EOTF used to encode the video signal does not directly apply to the kind of luminance contouring artifact I will be discussing in this DD. If the EOTF of the encoded video is not correctly transformed into the EOTF of the display device, it can create other types of artifacts, but not this luminance contouring.
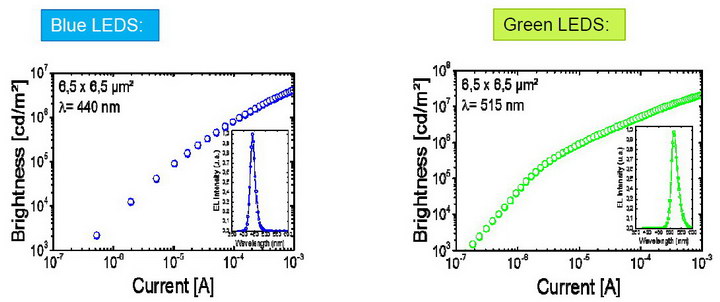 Figure 2: Electro-optical properties of GaN microLEDs from LETI (Credit: LETI)
The EOTF of the video signal is important in one sense – it is designed to minimize the number of bits needed to transmit all the information in the content to the destination over the entire range of brightnesses from very dim to very bright. This minimization of the bits is based on the same human factors used in my paper to determine the visibility of contouring at the display.
I won’t trouble you with the math, but it is (or should be) intuitively obvious that when the display device EOTF matches the video encoding EOTF, which in turn matches the eye’s response, the video is easiest to display and the fewest bits of drive are required. The linear plot used in Figure 1 emphasizes the difference between the curves at high brightnesses while downplaying the very important differences between the curves at low brightnesses, which is why log-log plots are normally used for modern figures of this sort. For example, Dr. François Templier used a log-log plot to show the EOTF properties of LETI’s microLED microdisplays, discussed in a recent Display Daily. Note this curve gives the output as a function of current, not voltage. More about that later.
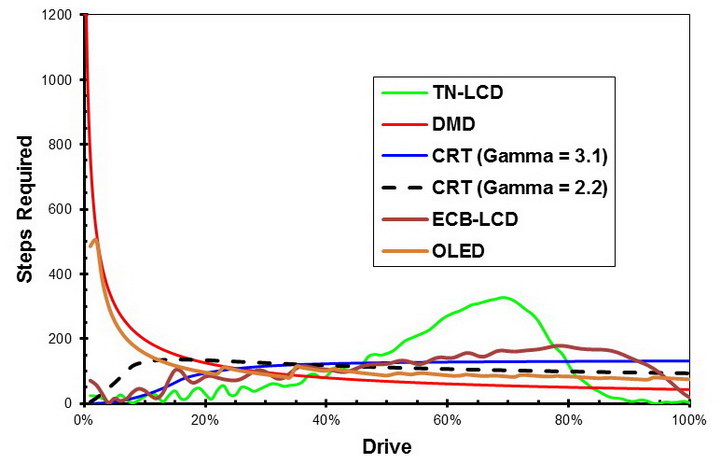 Figure 3: Steps required in the device drive signal to avoid luminance contouring at various drive levels. (Credit: M. Brennesholtz)
The curves in Figure 3 are based on the EOTFs for the various display devices in Figure 1. For this study, the OLED, TN-LCD and ECB-LCD curves were based on measured data while the CRT and DLP curves are theoretical. The calculations to go from the Figure 1 to Figure 3 include a numerical differentiation of the data, a notoriously noisy process for measured data. This accounts for the noise in the measured OLED, TN-LCD and ECB-LCD curves and the lack of noise in the equation-based DLP and CRT curves.
To calculate these curves it was necessary to use a function that describes what the minimum brightness difference a human can see between adjacent areas of nearly the same brightness. The CIE L*a*b* colorimetry system was used to calculate ?E, this minimum brightness difference the typical human eye can see. Calculations were based on ?E = 1.0 as the threshold of visibility. Modern high-end displays have stricter standards of image quality than 1998 CRTs, so a ?E of 0.5 or even lower would be appropriate if someone wanted to redo these calculations. There are also newer, more accurate and far more complex color-luminance difference formulas than the CIE L*a*b* formula I used.
The curves in Figure 3 show the minimum number of equally-spaced drive steps needed to encode an image on the screen that will be free from luminance contouring. The minimum number of levels required is a function of drive level but it is a requirement that a modern display have no contouring at any drive level, so the maximum value of each curve should be used. For example, it would take a total of 328 drive levels equally spaced between black and white to drive a TN-LCD display with a contour-free image in the mid-ranges, at the 69% drive level which would give 44% brightness with this TN-LCD.
8 Bits Not Enough
To get this many levels, 8-bit video drive isn’t enough – you need at least 9 bits. If fewer than 328 drive levels were used to drive the TN-LCD, luminance contouring would first be visible in the mid-grey region corresponding to 69% drive. The CRTs and the ECB-LCDs can all be driven by an 8-bit drive signal and still remain below the ?E = 1.0 at all drive and brightness levels. The OLED needs 503 steps distributed between black and white to avoid contouring at low brightnesses. Nominally, a 9-bit drive (512 levels) will provide enough steps, but it would be safer to use a 10-bit drive. The DLP display requires about 1200 levels distributed uniformly from back to white to avoid contouring at low brightness levels. 1200 steps requires the equivalent of 11 bits of drive for the DLP imager. If too few drive levels were used for the OLED, DLP or pulse-width driven LED display, luminance contouring would first appear in the dim regions of the image.
A lot has changed in the display world since 1998. One key thing that has changed and will affect the required number of drive bits is the increase in contrast for display devices. This comes from both higher brightness white points and lower brightness dark points. My 1998 study assumed 300:1 contrast for the CRT and DLP projectors, with measured 302:1 for the TN-LCD and 401:1 for the ECB-LCD. For the new OLED data, I have assumed a 3000:1 contrast – the data available to me was not accurate enough to give the true black level of that particular material. This higher brightness white and lower brightness black are two of the things that enable High Dynamic Range (HDR) systems today. Additional drive levels must be allocated to properly drive these new high and low brightness display regimes.
Current Drive vs Voltage Drive
Another thing that has changed since 1998 is the rise of current-driven display technologies. CRTs and LCDs are both voltage driven but LEDs of all types, including microLEDs, OLEDs and larger LEDs, are best characterized by their brightness vs current curve, such as Figure 2 for microLEDs. Unfortunately, it is more difficult to design an accurate and stable digital-to-analog (D/A) converter when accurate current values are desired than when accurate voltage values are desired. For voltage-driven systems, normally it is only necessary to take the non-linearity of the display into account.
OLED and microLED displays generally depend on the transistor at a pixel to transform the analog voltage input into an analog current output, which is then applied to the OLED stack or the microLED. For current-driven systems, normally it is necessary to take both the non-linearity of the light-emitting material and the transistor or other voltage to current device into account. These transistors vary from pixel to pixel and the gain and offset is often set by adjusting the digital drive signal, requiring more bits in that signal. In addition, OLEDs and microLEDs are more sensitive to temperature than CRTs or DLP imagers – more bits to do the correction digitally. OLEDs also have an aging problem which requires adjustment over life – more bits needed there, too.
All the problems of OLEDs and microLEDs also apply to macroscopic LEDs, except the serious OLED lifetime issue. LED displays have a lifetime of up to 130,000 hours or more and it isn’t that big an issue. On the other hand, LED video walls often use pulse width modulation, with the higher inherent bit count drive requirements of a DMD, 11 bits minimum. Hence, when it was suggested that LEDs require 16 – 20 bits of drive, I wasn’t too surprised. At least, not after I had a chance to scratch my head and think about it. –Matthew Brennesholtz