Yesterday, we published the first part of my article on LG Display’s strategic challenges in moving from LCD to OLED. (LGD’s Dilemma – LCD Panels Unprofitable & Getting Worse, But OLEDs Can’t Carry the Revenue Burden (Part 1)) Today, in Part 2, I’m digging down into some more of the financial background.

On 27 July, LG Display reported 2Q FY12/22 sales of ?5.607 trillion ($4.27 billion) (down 20% Y/Y and down 13% sequentially), an operating loss of ?488 billion ( $317 million) (swinging to a loss on a Y/Y and sequential basis), and a net loss of ?382 billion ($291 million) (swinging to a loss on a Y/Y and sequential basis). The gross profit margin (GPM) was 4.9% (12.6% in 1Q), while operating profit margin (OPM) was -8.7% (0.6%), and the net profit margin (NPM) was -6.8% (0.8%). The EBITDA margin was 11.8% (18.7%).
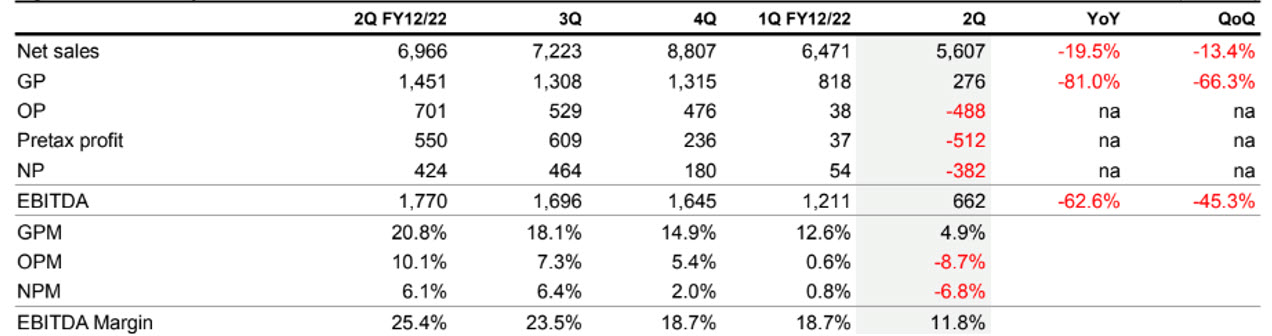 Table 1: Summary of LGS’s Q222 Results (? billions) Source:Company Data
In Q222, shipments in terms of surface area reached 7.8 million m² (down 12% Y/Y, down 4% sequentially), well below the company estimate, issued when it announced 1Q results, for a sequential decline in the lower end or middle of the 10%–20% range. Weakness was largely attributable to the effects from the lockdowns in China, final demand proving weaker than previously expected, and brand-name companies adjusting their orders. Blended ASP was $566/m² (down 14% from $660/m² in Q122), which was below the estimate for a sequential drop of about 10% issued by the company when it reported 1Q results. The decline in the ASP was due to mix deterioration (a decline for mobile) and lower panel prices for LCDs. Production capacity in 2Q totalled 10.9 million m² (versus 11.5 million m² in Q122), mainly due to capacity in LCD production and maintenance operations.
In 2Q, 31% of panel sales were for TVs (versus 26% in 1Q), 45% were for IT devices such as monitors, laptops, and tablets (versus 48%), and 24% were for mobile devices and others (versus 26%). In value terms, TV panel sales were down 34% Y/Y and up 3% sequentially. IT device panel sales were down 7% Y/Y and down 19% sequentially, and sales of panels for mobile devices and other applications were down 16% Y/Y and down 20% sequentially. At the end of 2Q, days in inventory (the average between the beginning and end of the quarter on a CoGS basis) surged to 76.6 days, up from 61.2 days at the end of 1Q. In value terms, inventory rose 73% Y/Y and rose 12% sequentially. The increase in inventories was due to supply chain disruptions brought on by the lockdowns in China and an increased proportion of value-added products such as OLED.
Key takeaways from the company’s Q322 guidance include:
- Shipments in surface area to expand around 5% sequentially, mainly on the normalization of production line operations in China and an increase in shipments of small- to medium-sized OLED panels and large OLED panels. Following the downturn in 2Q, the company expects the recovery in 3Q to be somewhat muted.
- Blended ASP to improve roughly 20% sequentially, largely on an increased weighting in mobile OLED and TV OLED panels. The company stated during the earnings call that customers (e.g., TV brands) have become more conservative in their procurement due to the slowdown in the economy and the drop in end-use demand, and that customer inventory levels appear likely to remain excessive for the next four to seven weeks. LGD expects LCD panel prices to continue to fall Q322 due to inventory adjustments, but that they also believed prices were likely to stabilize in Q422 in line with capacity utilization adjustments among the panel manufacturers.
- The company indicated that it would adopt a flexible stance toward capacity utilization adjustments in order to reduce inventories, which appears to suggest deeper production adjustments in 2H FY12/22. In addition, the company reiterated its intention to reduce production capacity in LCDs for TVs, saying that it will reduce capacity by 40% by 2H 2023 compared to 1H 2022. The P7 plant in South Korea, which has production capacity of 150,000 units/month, plans to reduce its capacity to 60K units/month by the end of 2022 and to 30,000 units/month in 2H 2023. The company also intends to convert TV panel production lines in China to IT panel production lines.
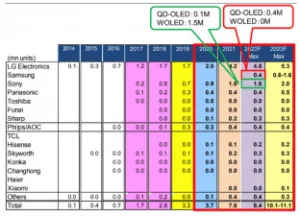
- Large OLED (white OLED) business — while the OLED TV market expanded 25% Y/Y in H122, the company expects this growth rate to slow to about 15% Y/Y in 2H22 due to the adverse effects from the economic slowdown and inventory adjustments. The company lowered its forecast for TV OLED panels, with management now expecting only a slight Y/Y increase (the company previously expected shipments to rise more than 20% Y/Y to 9–10 million units from 7.6–7.7 million units in 2021). Management noted that the company is in negotiations to supply OLED panels to Samsung Visual Display (TV division), but also commented on a lack of clear progress in those negotiations.
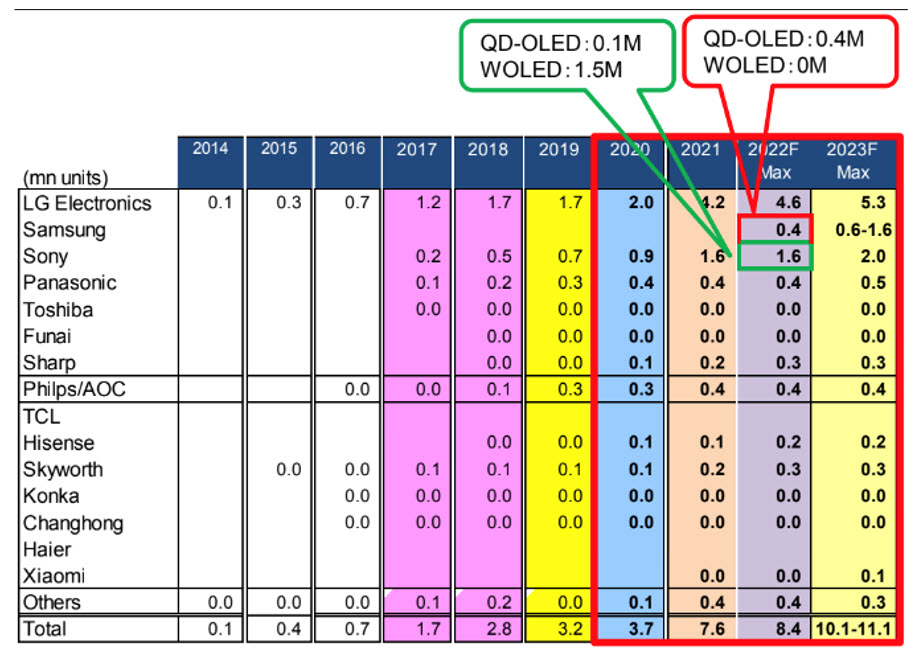 Table 2: OLED TV Shipment Forecast by Brand – Source: Mizuho Securities Equity Research
- Capex — LGD is revising the wording of its 2022 capex plans so that investment does not exceed “depreciation.” The company’s previous capex plans called for capex to exceed the 2021 level (?3.2 trillion) due to investment in the G6/OLED plant, but not to exceed “EBITDA.”
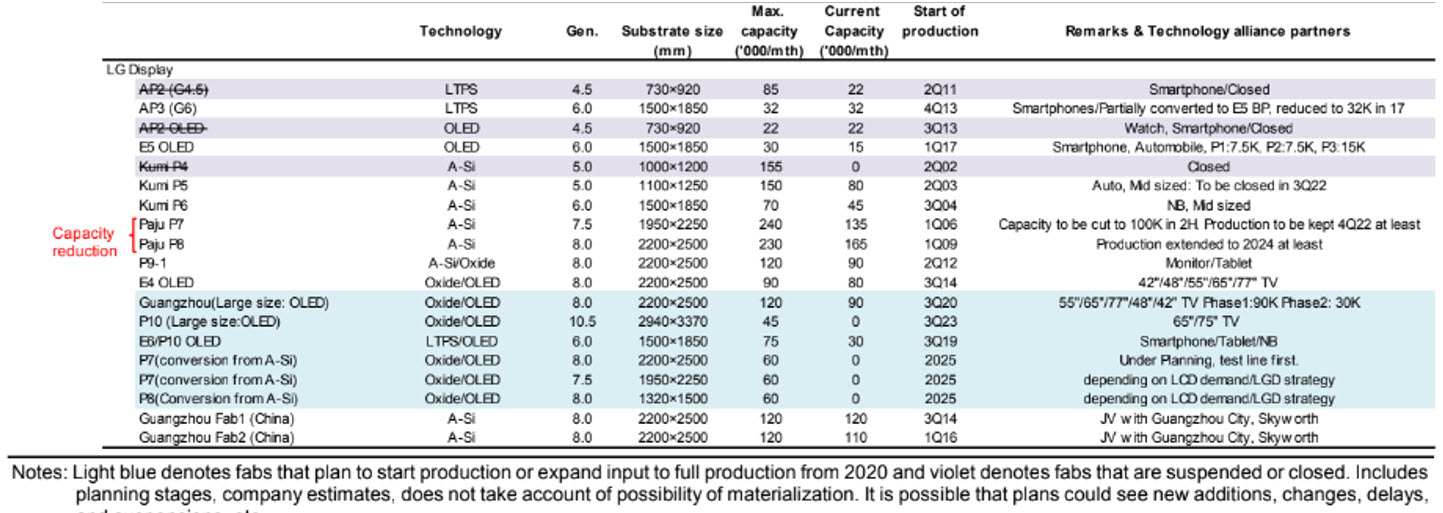 LGD Capex Plans – Click for higher resolution – Source: Mizuho Securities Equity Research
The next two charts show LGD’s dilemma in terms of product mix and ASP. Over the last two years LGD’s average mix has shifted with IT and Mobile up 5% each, TVs down 10%, while the ASPs have dropped by $40 per m². The change in ASP is an anomaly, since the $/m² is typically the inverse of the size of the panel. As a result, LGD’s average revenue over the last three years is down by $1.2 billion /month.
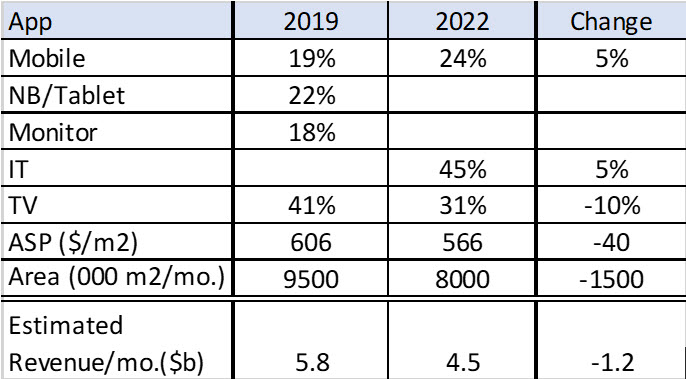 Table 4: LGD Shipment Share by App, Source: Mizuho Securities Equity Research, OLED-A
 Figure 2: LGD Area Shipments by m² and ASP – 2011-2022 – Source: Mizuho Securities Equity Research
(BY)
Note that this article and yesterday’s are counted as only one of your free articles if you do not have a paying subscription.
Barry Young is CEO of the OLED Association