Watching eyeballs in the auditorium roll up into their sockets has always been one of the benefits of being a frequent speaker at events such as the upcoming SID Display Week. One sure-fire way to get the fun started is mentioning the inverse Herfindahl-Hirschman Index. Since I am getting ready to do that for the 20th year, I think it is time to explain what I mean in more detail and apply the metric to display market conditions.

Think about the problem of representing the effective power of alternating current coming out of the wall socket. The voltage goes up and down, from plus to minus. How should we measure it? Electrical engineers decided to square the instantaneous voltage values over a complete sine wave (two Pi radians to you who recall such things) then add them together and take the square root. They call this the root-mean-squared (RMS) value.
Orris Herfindahl used a variation of the RMS concept in his 1950 doctoral dissertation (he died tragically hiking in Nepal, which is another interesting link to the present). Many economists, especially inside government agencies, adapted the metric to characterize market concentration or to identify mergers/acquisitions that might reduce competition. Regulators tend to square the market shares of competitors in a given market, add those together, then take the square root. This yields a percentage of market share per equivalent (effective, weighted) supplier. In the USA, a result of 25% share would indicate a concentrated market and suggest that more concentration would be bad for consumers.
I often use an inverse function (1/index) to indicate the number of equivalent competitors. In the case of 25% share, that means four equivalent rivals (1/0.25). The greater the number of rivals, the more rivalry might lead to adverse outcomes for producers (but not for consumers!). In other words, if market A has 3 nominal rivals while market B has 9 nominal rivals, then competitors in market A are more likely to read and believe each others’ signals and use tit-for-tat pricing retaliation to keep prices in a profitable range than are competitors in market B. Some competitors in market B may think they can capture share in certain segments by pricing near cost. Or, they may be less able to perceive or believe each others’ signals. As a result, we see long-term profitability in concentrated markets (e.g. glass substrates) and cyclic profit/loss in more diverse markets (e.g. LCD panels).
LCD Industry Rivalry
I have been modeling the FPD industry for 20 years and I am about to retire so I thought it would be interesting to look at data going back before some readers where active in the business. I leave future analysis to Charles Annis of IHS Technology, a great analyst who will take things further than I can.

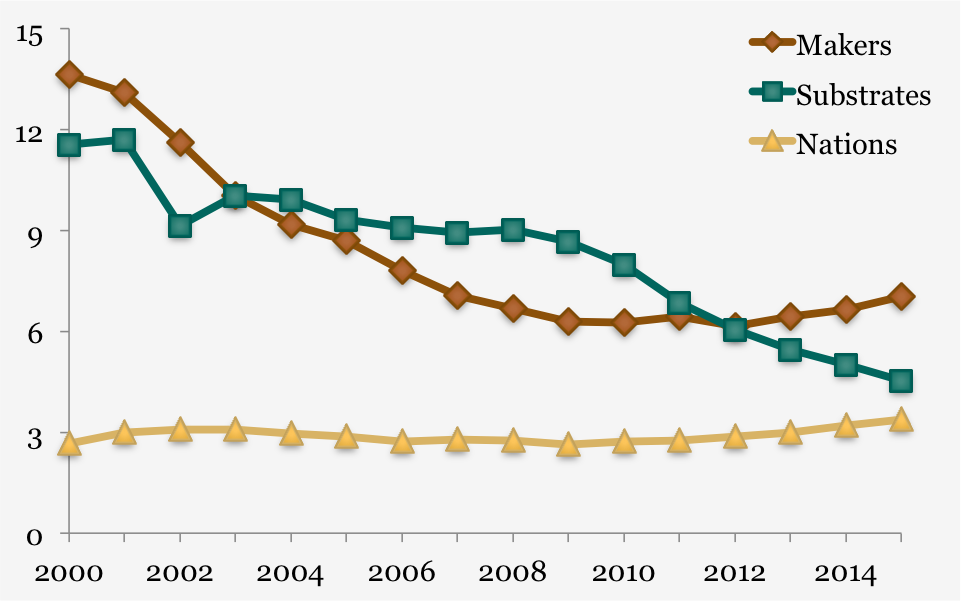
The chart plots rivalry for three aspects of the AMLCD industry in terms of TFT process area capacity: the number of equivalent panel makers, the number of equivalent substrate sizes and the number of nations with AMLCD fab capacity. The composition of each metric ranges from more than 40 panel makers to 33 substrate sizes to 6 nations. Clearly, rivalry among panel makers would be greater than rivalry among nations. What is more interesting is the change in rivalry over time.
Looking at panel makers, rivalry was greatest in the early years. Most people today would not recognize the name Display Technology (DTI) but it was the largest producer 20 years ago. Most producers from the period of Japanese domination have left the field. Rivalry reached its nadir in 2012, post Great Recession. Since then, it has increased to 7, commensurate with the rivalry index of 2007… a recovery? I expect rivalry will increase further as BOE and other Chinese producers add capacity.
It is interesting to note a downturn in substrate rivalry since 2008, the start of a macro-shock. Producers have converged on the Gen-8 platform, which makes the Gen-10 announcement by BOE so interesting. Will others follow?
About the same time, we see a rise in national rivalry. Chinese producers are driving the bulk of capacity growth, now. We read about a resurgence of Taiwanese investment but the whole country may spend less annually than a single Chinese producer, near term, and I suspect China will pile into the business for the remainder of this decade.
In summary, I expect producer rivalry will increase before decreasing after China completes its expansion and rationalizes its supply chains. Meanwhile, production mix rivalry will increase as producers seek ways to slice a narrower range of substrate sizes into a wider range of panels. 8K TV and 1200 ppi mobile panels seem inevitable. – David Barnes

