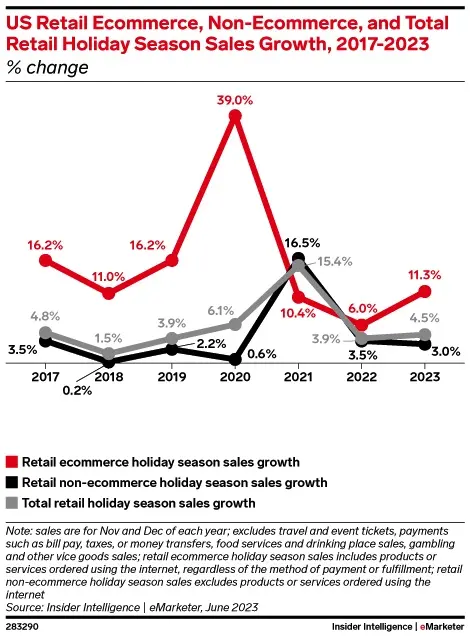
By all accounts, during the upcoming holiday shopping season in the US, we should see growth and record breaking.

The question is, what does this mean for display sales. We do have some possible indications of what the season holds if we look at what happened during China’s holiday shopping season.
The Lessons of 11.11
The 11.11 or Singles Day shopping festival in China, now in its 15th year, concluded with reports of record numbers and positive growth, signaling strong consumer spending power but the major e-tailers seemed reluctant to release actual numbers. Despite the absence of a final sales tally and a seemingly lower consumer enthusiasm compared to previous years, the festival is still considered a reliable indicator of consumer sentiment. Domestic brands saw the biggest lift in sales, marking a shift in China’s consumer market trends.
E-commerce platforms like JD.com reported new records in transaction volume, order volume, and user numbers, although specific figures weren’t provided. China’s State Post Bureau highlighted a record handling of 639 million parcels, a significant increase from the previous year. Alibaba reported positive year-on-year growth in GMV (gross merchandise value), order number, and participating merchants. Other online platforms, including livestream sites like Kuaishou and Douyin (TikTok’s sister app in China), also reported robust sales figures, with Douyin noting over 50% increases in daily average GMV and order volume.
Sales forecasts for this year’s event predicted a return to double-digit growth for the first time since the pandemic, with analysts estimating a total GMV growth between 14% and 18%. This robust performance underscores the strength of consumer spending, despite some reports suggesting a loss of luster for the event amid economic pressures. Consumers continued to spend heavily on necessities and discounted items. For example, a Beijing resident reported spending about 40,000 yuan, mostly on big-ticket items, reflecting larger discounts on such products during the festival.
Chinese policymakers have implemented measures to boost consumption, which has become a key driver of economic growth. With policy support, China’s consumption has been steadily rebounding, as seen in the first nine months’ retail sales growth and the surge in online sales. During the festival, the prominence of brand recognition and livestreaming as a sales channel was evident. Alibaba noted that hundreds of brands, including many Chinese ones, surpassed significant GMV thresholds, and JD.com reported that its livestream services attracted over 380 million viewers.
Now, let’s look a little closer at what we learned about display sales during this period from Sigmaintell. China’s display market has emerged as a study in contrasts according to the company’s analysis and Sigmaintell decided to dig into one segment with a review of standalone IT monitor sales. So, keep that in mind in this analysis of display sales.
This year’s event wasn’t just about deep discounts and flashy sales; it was a litmus test for the health and direction of the industry in the world’s largest consumer market. Despite an impressive uptick in sales volumes – a 7.6% year-over-year jump, totaling 1.1 million units across e-commerce giants JD and Tmall – the market’s revenue story tells a different tale. A modest 1.5% drop in sales revenue and an 8% slump in average prices underscored a persistent trend: more units sold, but at lower prices.


2023’s Singles Day also spotlighted a significant reshaping of brand dynamics in the Chinese display market. Local brands, leveraging their agile supply chains and cost-effective strategies, ate into market shares previously dominated by global giants, with mid-tier and emerging brands gaining ground in an increasingly competitive arena.
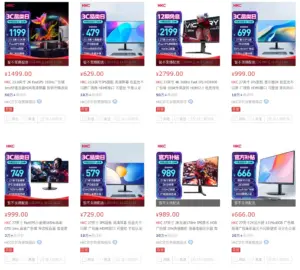
TPV maintained its lead but with a dwindling grip on market share. In contrast, Xiaomi and HKC made notable gains, with HKC’s aggressive pricing and product strategies propelling it to a strong third place in the market. Asus rebounded from earlier setbacks, tweaking its product lineup to better suit the shifting market currents. Meanwhile, brands like Samsung and LG faced headwinds, grappling with the dual challenges of maintaining premium brand positioning while trying to stay competitive in a price-sensitive market.
Looking ahead, Sigmaintell forecast a 2024 where the remains pretty much in line with 2023, still of its highs in 2015. While the lower-end market continues to expand, it’s expected that international brands will double down on balancing premium offerings with cost-effective strategies, potentially slowing the rapid downturn in the mid-to-high-end segments. Obviously, the slowdown in IT spending has played as much of a role in the change in market dynamics as has sanctions.
Thanksgiving Shopping Projections
So, what are the predictions for the upcoming Thanksgiving break? The National Retail Federation and Prosper Insights & Analytics revealed that a record-breaking 182 million shoppers are expected to hit stores and online from Thanksgiving through Cyber Monday. This marks a significant increase of 15.7 million from last year, the highest since 2017. NRF President Matthew Shay highlights the readiness of retailers for these pivotal shopping days.
An impressive 74% of consumers are set to shop during this period, up from 69% in 2019. The driving forces? Irresistible deals (61%) and tradition (28%). Black Friday remains the favorite shopping day with 130.7 million participants, while Cyber Monday attracts 71.1 million.
Early shopping trends continue, with 59% already browsing and buying, completing about a quarter of their holiday shopping. Most have bought gifts, while others have picked up decorations or treats for themselves.
Phil Rist of Prosper Insights notes that over 40% of shoppers have responded to October promotions. Despite early shopping, the Thanksgiving to Cyber Monday period remains a shopping highlight.
Holiday spending is projected to soar between 3% and 4%, reaching up to $966.6 billion, surpassing last year’s $929.5 billion. This aligns with the average annual increase of 3.6% since 2010. The survey, with a margin of error of ±1.1 percentage points, involved 8,424 adults and was conducted from November 1-6. As always, NRF remains a key source for retail industry insights and consumer spending data.
Waiting and Hoping
There’s a couple of interesting points to be made about this year’s shopping season: it may be looking like record-breaking numbers but it could also be that consumers are looking for bargains and loading up all purchasing during this period. So, you get nice spikes in sales but that doesn’t translate into trends and ongoing market strength. People are going to try and buy as much as they need at the lowest prices, if you will.
Then they stop.
I am going to enjoy my Thanksgiving break. I hope you enjoy yours, even if you are somewhere where you don’t have the time off (I am not forgetting all of our international subscribers). But, I can’t help feeling that we have very little understanding of what shopping trends means for monitor sales, TV sales, or even smartphone sales. Maybe because people don’t know what to expect from their jobs or the economy.
That’s an ideal opportunity for budget and mid-tier brands to gain traction in the market. It will be interesting to see if that is what happens when all the data has come in.

