The display industry has experienced a notable recovery in 2023, with a significant increase in display fab utilization during the first half of the year. According to the latest release of DSCC’s Quarterly All Display Fab Utilization Report, the uptrend in utilization has continued into the third quarter. This rebound can be attributed to the trimming of inventory levels in the display supply chain, leading to increased demand for flat panel displays. However, there is a cautionary note as the surge in utilization by LCD makers may potentially overshoot demand, putting the industry at risk of oversupply and impacting panel prices.
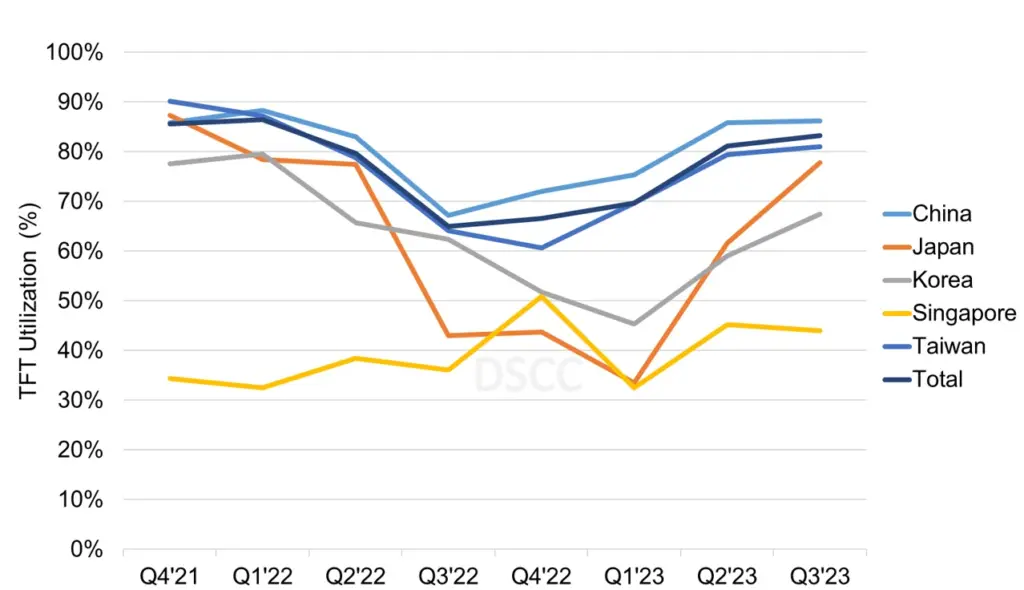
The 2021-2022 period witnessed significant fluctuations in fab utilization, influenced by various factors. The pandemic-driven demand surge boosted fab utilization in Taiwan and China in 2021 and the first quarter of 2022. However, macroeconomic and geopolitical shocks caused demand to plummet, leading to a decline in utilization by 6% in Q2’22 and an additional 15% in Q3’22, reaching a low point of 65%. Utilization experienced a slight recovery to 67% in Q4’22 and further increased to 70% in Q1’23, finally reaching 81% in Q2’23. Based on the latest update, DSCC expects utilization to rise to 83% in Q3’23, but to taper down to 79% in Q4’23.
Co-Founder and CFO of DSCC, Bob O’Brien, notes that the recovery has been most rapid in China, but OLED production lines experienced a more severe and prolonged slowdown compared to LCD lines. This disparity can be attributed to Korea’s higher share of OLED capacity, while all other regions are predominantly LCD-focused. For instance, in Q3’23, 59% of Korea’s capacity is dedicated to OLED panels, while China’s percentage stands at only 6%, and other regions have negligible OLED capacity.
The downturn in LCD fabs was primarily caused by sharp reductions in LCD panel prices and an inventory build-up. While LCD capacity can be partially interchangeable, OLED capacity is different due to the existence of five distinct classes, each with little overlap between them. These classes include white OLED capacity for LG Display (LGD) and QD-OLED capacity for Samsung Display Company (SDC) for OLED TV and monitor panels, rigid OLED capacity for smartphones and tablets, RGB OLED capacity for IT applications, and flexible OLED capacity for smartphones.
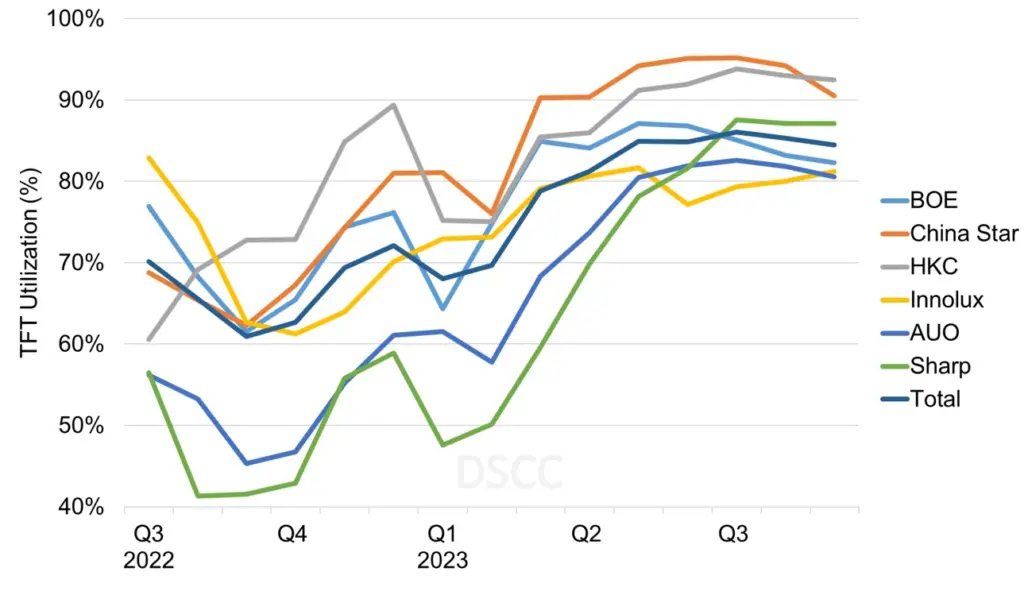
A closer examination of LCD utilization by manufacturer shows that the top seven LCD makers, comprising 87% of the industry’s LCD input by area, experienced a dramatic recovery in Q2’22. Some companies recovered faster than others, with AU Optronics (AUO) and Sharp facing the deepest downturn and the slowest recovery. AUO chose to maintain prices and turn away business rather than compete at lower costs. However, with LCD TV panel prices increasing in Q2’23, AUO was able to raise its utilization.
Sharp, on the other hand, faced challenges in 2022 and lags behind Chinese panel makers in 2023. Sharp’s capacity is dominated by its two G10+ lines in Japan and China. The Sakai fab struggled with extremely low utilization for nine months, but it rebounded significantly in Q2’23 and is forecasted to reach 95% utilization in Q3.
As the display industry emerges from its worst downturn in over a decade, the focus now shifts to balancing industry capacity with demand. The drive for higher utilization must be carefully managed to prevent potential oversupply and its subsequent impact on the industry in the second half of 2023.