Between the end of 2010 and end of 2015, digital TV penetration jumped from 40.4% to 74.6% of global households, says Digital TV Research. The figure represents an increase of about 584 million homes, and doubled the digital TV household total to 1.2 billion.
Of these 584 million homes, 156 million came from households using DTT as their primary reception method. Digital cable contributed a further 231 million; pay-IPTV 88 million; and pay-satellite 67 million. However, there were still 398 million analogue TV households (terrestrial and cable) by the end of last year.
Regionally, 381 million of the new digital households came from APAC – more than doubling the total number in that market, to 608 million. China became the largest digital TV country in 2010, and by the end of 2015 had 29% of the world’s total DTV households (339 million).
In 2015, there were 907 million pay-TV households globally – up from 716 million in 2010. APAC represented two-thirds of these additions (126 million), bringing its total to 520 million. China had the most pay-TV subs (264 million, up from 69 million), followed by India (adding 32 million between 2010 and 2015). The number of digital pay-TV subscribers rose from 382 million to 771 million over the same period.
Pay-TV revenues reached $206 billion in 2015, up 19.4% from $172 billion in 2010. The US led the market, with revenues almost 10 times higher than second-place China.
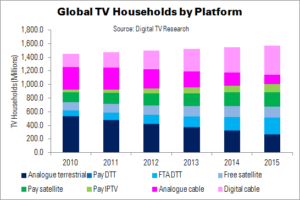
| Global TV Households by Platform (Millions) | ||||||
|---|---|---|---|---|---|---|
| Platform | 2010 | 2011 | 2012 | 2013 | 2014 | 2015 |
| Analogue terrestrial | 526.6 | 473.5 | 419.5 | 364.6 | 319.8 | 261.9 |
| Pay DTT | 8.3 | 8.2 | 8.3 | 8.5 | 9.9 | 12.6 |
| FTA DTT | 83.0 | 100.4 | 121.8 | 156.2 | 193.4 | 239.4 |
| Free satellite | 123.8 | 133.0 | 143.4 | 149.4 | 156.0 | 159.5 |
| Pay satellite | 143.1 | 160.1 | 175.9 | 187.9 | 203.2 | 209.8 |
| Pay IPTV | 36.3 | 53.1 | 70.8 | 86.7 | 101.8 | 123.9 |
| Analogue cable | 334.1 | 315.6 | 283.4 | 239.9 | 188.2 | 135.6 |
| Digital cable | 193.9 | 227.8 | 271.0 | 325.7 | 374.1 | 424.9 |
| Source: Digital TV Research | ||||||