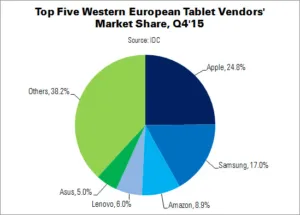
More than 14 million tablets were shipped to Western Europe in Q4’15: a 10.1% decline YoY, says IDC. In value terms, however, the decline was only 1.8% thanks to the rising penetration of detachable tablets. 2.6 million detachables were shipped in Western Europe in Q4, up from around 800,000 in Q4’14. They now account for almost 20% of the overall tablet market.
Detachables have a wide range of specifications and appeal to many consumers and business users. The form factor has been successfully adopted by business professionals, and is increasingly seen as a notebook replacement.
Microsoft’s Surface boosted the company to market leadership last year. However, Apple entered the space in Q4 with the iPad Pro, and captured a ‘good’ share, IDC said. A new, more powerful generation of processors will support commercial shipments in the coming quarters, it is thought. Meanwhile, the home segment will benefit from an increase in the supply of affordable detachable models. Vendors have been adjusting their portfolios to counter low demand for slate-style tablets. IDC notes that, if the growing Windows detachable market were combined with the declining notebook PC results, the market for client devices in Western Europe would be flat.
In the consumer space, traditional seasonal sales trends were disrupted in Q4 as vendors brought forward shipments to the final weeks of Q3. This was done in preparation for Black Friday and early Christmas promotions. The exception was Amazon’s low-cost 7″ tablet; the company shipped almost 1 million units in Q4, and pressure rose on non-branded and entry-level products.
Strong appeal from other consumer segments, such as wearables, meant that demand for tablets was lower than expected as consumers looked at alternative products for Christmas presents.
On the commercial side, tablet performance varied between countries. Macroeconomic factors and varying levels of digital and mobile readiness affected the pace of deployments.
The new form factor mix, with the inclusion of detachables, helped to increase market value. Marta Fiorentini, research manager at IDC, said, “This is especially important in [the consumer space], where slate tablet prices have been declining for a while without necessarily rekindling demand. This quarter, the danger of a sharp drop in value was very real but thanks to detachables, the average market price increased by 3.8% YoY”. Commercial ASPs rose by 26%, due to both higher detachable penetration and the higher prices of commercial tablets in general.
| Western European Tablet Shipments by Vendor, Q4’15 (000s) | |||||
|---|---|---|---|---|---|
| Vendor | Q4’15 Unit Shipments | Q4’14 Unit Shipments | Q4’15 Share | Q4’14 Share | YoY Change |
| Apple | 3,488 | 4,623 | 24.8% | 29.6% | -24.6% |
| Samsung | 2,384 | 2,510 | 17.0% | 16.1% | -5.0% |
| Amazon | 1,256 | 541 | 8.9% | 3.5% | 132.0% |
| Lenovo | 849 | 805 | 6.0% | 5.2% | 5.4% |
| Asus | 708 | 1,110 | 5.0% | 7.1% | -36.2% |
| Others | 5,369 | 6,041 | 38.2% | 38.6% | -11.1% |
| Total | 14,055 | 15,631 | 100.0% | 100.0% | -10.1% |
| Source: IDC | |||||
Apple continued to lead the Q4 tablet market in Western Europe, despite a strong fall in iPad Volumes. Shipments of the iPad Pro only partially compensated. Samsung declined less than the overall market, thanks to its targeting of all market segments. On an annual basis, the company actually strengthened its position, and closed in on Apple.
Amazon climbed to third place, riding the popularity of its new 7″ tablet. Lenovo fell to fourth place despite out-performing the market with 5.4% growth. However, for 2015 overall the company remained in third place. Asus came in fifth in Q4, focusing on profitable growth and raising its profile in the premium segment.
| Western European Tablet Shipments by Vendor, 2015 (000s) | |||||
|---|---|---|---|---|---|
| Vendor | 2015 Unit Shipments | 2014 Unit Shipments | 2015 Share | 2014 Share | YoY Change |
| Apple | 9,619 | 11,985 | 24.7% | 28.8% | -19.7% |
| Samsung | 8,929 | 9,021 | 23.0% | 21.6% | -1.0% |
| Lenovo | 2,425 | 2,072 | 6.2% | 5.0% | 17.0% |
| Asus | 2,098 | 3,097 | 5.4% | 7.4% | -32.2% |
| Amazon | 1,431 | 906 | 3.7% | 2.2% | 58.1% |
| Others | 14,405 | 14,587 | 37.0% | 35.0% | -1.2% |
| Total | 38,910 | 41,668 | 100.0% | 100.0% | -6.6% |
| Source: IDC | |||||

