Display Supply Chain Consultants (DSCC) has released the latest issue of its Quarterly Display Capex and Equipment Service? which tracks the display equipment market for 40 segments by:
- Equipment supplier
- Panel manufacturer
- Frontplane technology
- Backplane technology
- Generation (backplane and frontplane size)
- Country
- Units
- Revenues
- ASPs
- Bookings basis
- Billings basis
- Quarterly basis
- Annual basis
Highlights of the report include:
- 2017 was a record year for the display equipment market, with revenues up 30% to a record high $24.7B as shown in Figure 1. Capital-intensive OLED fabs drove the spending up 143% to a record $15.5B or 63% of display equipment spending, up from 34% as shown in Figure 2. LCD fab spending was down 27% to $9.2B and a 37% share, down from 66%. Samsung Display was the largest customer on 54% growth to over $7.5B or a 31% share of display equipment spending. Samsung’s share of OLED equipment spending was 48%. BOE was the 2nd largest display equipment customer on 229% growth to $6B and a 24% share. China was the #1 region in 2017 with a 51% share of spending compared with Korea at 42% as shown in Figure 3. 6G was the dominant glass size with a 55% share, up from 52%.
- In 2018, display equipment spending is expected to fall 9% to $22.5B, although equipment bookings are expected to rise 5% to a record $24.8B as 2019 spending is expected to rise Y/Y. OLED spending is expected to fall 11% in 2018 with LCD spending down 6%. Driving the decline in OLEDs is slower than expected capacity growth at Samsung’s next fab for many different reasons with Samsung’s equipment spending expected to drop by 64% in 2018. BOE is expected to replace Samsung as the #1 display equipment customer in 2018 with its spending rising 12% to nearly $6.7B and its share reaching 30%. LG Display is expected to be the #2 customer in 2018 with a 15% share. The LCD share of spending will rise slightly from 37% to 39% as the 10.5G share of equipment spending rises to 22%. China’s share of 2018 display equipment spending is expected to reach 78% in 2018 on a 37% increase in spending fueled by government subsidies to support LCD TV and OLED smartphone manufacturing goals. 2018 is expected to be the first year where China leads in OLED spending with a 64% to 36% advantage over Korea.
- 2019 looks to be a record year with BOE, China Star, LG Display and Samsung all spending at least $3.6B on display equipment. Equipment revenues are expected to rise 10% to a record $24.8B with OLED spending up 8% and LCD spending up 14%. 2019 is expected to be a record year for display equipment spending targeting both smartphones and TVs with LG Display projected to lead in spending. China’s share is expected to fall to 66% with Korea’s share rising to 27%. China will continue to lead in OLED spending with a 64% to 33% advantage over Korea, however, Samsung will return to the top position in OLED equipment spending with a 24% share compared to BOE at 17% and LG Display at 16%.
According to DSCC Founder and CEO Ross Young, “2017 – 2019 represents an unprecedented $72B of equipment spending on display capacity fueled by capital intensive OLED fabs targeting smartphones and TVs and 10.5G LCD fabs targeting the 65” and larger TV market. This level of spending would not have been possible without Chinese government subsidies enabling their suppliers to compete more aggressively on cost and scale with Korean suppliers Samsung and LG. Consumers will benefit from all of this capacity which will drive down costs and prices. This report does an excellent job of quantifying spending and capacity growth and identifying which equipment companies are most likely to benefit by quantifying current and future market share and revenues by equipment supplier.”
For more information on DSCC’s Display Capex and Equipment Servicewhich tracks fab schedules, equipment spending, capacity growth, technical trends, design wins, equipment awards and supplier financial analysis, please contact [email protected] or (832) 451- 4909.
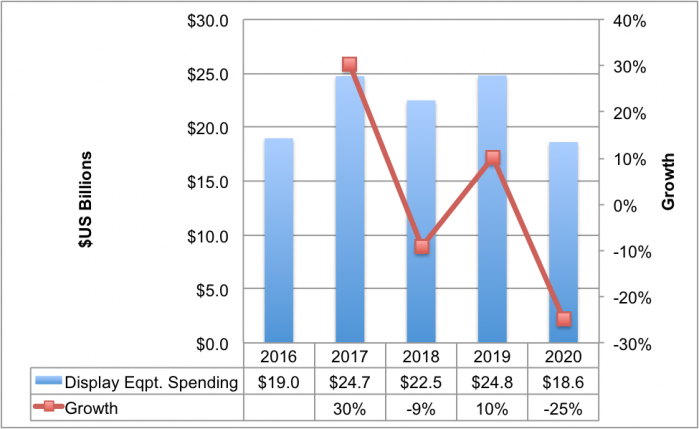
Display Equipment Spending and Growth
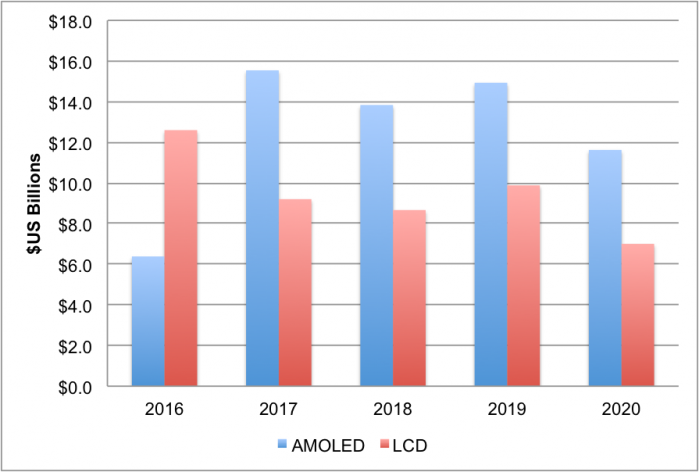
OLED vs. LCD Equipment Spending
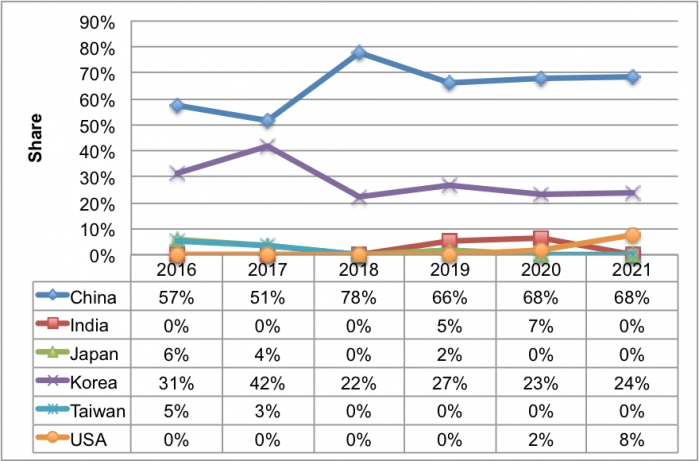
Display Equipment Spending by Region