I read several articles in Display Daily recently with relationship to Global Warming, which almost all of us believe to be related to the CO2 levels. Without getting into the political and technological side of the stories, I would like to take a fresh look from the mathematical side. How does the CO2 level changes possibly produce what we observe and what we feel today?

Let’s look at the published curves of CO2 level in the last thousands of years. Obviously, the level has increased a lot over a “short” period of time relative to the ‘Thousands of Years’ time scale.
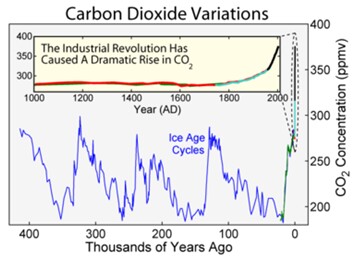
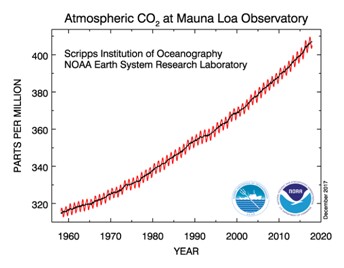
It is shown that in the last thousands of years, the average levels were in the 250 ppm level. Then, in the 1850’s, the beginning of the industrial age, the CO2 level increased and accelerated “exponentially” to the current level of over 400 ppm. What does this mean from the mathematical system point of view?
As an undergraduate who needed to make a living and pay tuition, I had to work part time during the school years. I was lucky enough that I got a job as a programmer in the Planetary Science Department helping a professor setting up mathematical models solving the Heat Equation using then, the most powerful IBM 370 computer with 64K of RAM. It was literally, a very large memory. The whole system was housed in the Computer Center, which was a big building. The goal was to compute the equilibrium surface temperature of the Moon, and later on, the Mars, based on the Sun’s irradiation. Various parameters were used to model the textures, thermal conductivities, and thicknesses of the “earth” layers under the surface. The mathematical goal was to match the actual measured surface temperature versus the calculated temperature so that a better understanding of the underlying ground structure could be obtained.
The method was very simple. I set up a numerical analysis model using the standard Finite Difference Method, divided the Moon into many segments, put in an initial condition of the temperatures, and allowed the Sun to shine on it. The computer would then rotate the Moon and the temperatures were calculated during this mathematical rotation. With sufficiently long time, and sufficiently large number of rotations, called “Lunations” (lunar days), equilibrium would be achieved. The equilibrium temperatures would be compared with actual measurements. The whole process would be repeated until the results matched.
Each equilibrium temperature profile was achieved usually with 300 to 400 lunations and it took many equilibrium temperature profiles to get a match. This process does not sound very difficult today, but in those days, it took a couple of months and thousands of dollars of computer time using the most advanced IBM 370 at the time. My computer program was about 3,000 cards long, if you know what that means. Part of my job was also to shorten the computer time and lower the cost of computer time.
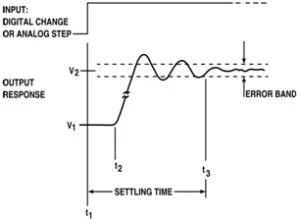
During the process, I studied the time behavior of pre-equilibrium profiles extensively in details. I was able to develop an interpolation and extrapolation methods reducing the number of lunations required and reduced the computer expenses tremendously. As I observed, the variations of the pre-equilibrium behaviors were quite complex, but among the complexity, I could see “ringing” in the time behaviors. I use the term “ringing” as this is often used in electronic circuits where the output “rings” when the circuits are excited by an impulse or a step function. A simple system will produce a simple ringing waveform and a complex system would produce a complex ringing waveform. In much simpler terms, the ringing is equivalent to a swinging pendulum. Compound pendulums would produce complex swinging patterns.
These memories of the work prompted me to think about the current weather abnormalities around the world in relation to the CO2 concentration. In the time scale of thousands of years, the increase of CO2 level from 250 ppm to over 400 ppm, which took about 100 years, could be considered as a step function. As the earth can be considered to be a very complex system, the step response to CO2 is expected to be very complex and could be very much unpredictable. I am living in Los Angeles and there have been a lot of forest fires recently. The most serious one is the Thomas fire, which burned for several weeks. The burned area is so huge that the size would cover the whole of Manhattan and Newark as shown in thes maps, published before the last Christmas in the LA Times, in which the burned area is overlaid on top of the New York map.
This is commonly believed that such frequent fires and extreme fires are caused by global warming, which in turn, caused by high level of CO2. At the same time, there has been extremely cold weather where snow falls in places where snow rarely fell in the past. Typhoons in Asia developed more frequently and with more strength. From a mathematical point of view, these extreme patterns can be considered as peaks and troughs in the ringing response to the step function of CO2 level and the earth is a very complex “pendulum”. With the latest fast computers, I hope that the mathematical model of the earth can be made more accurate with more factors included using high end computers, multi-processors, and distributed computing.
Back to Displays
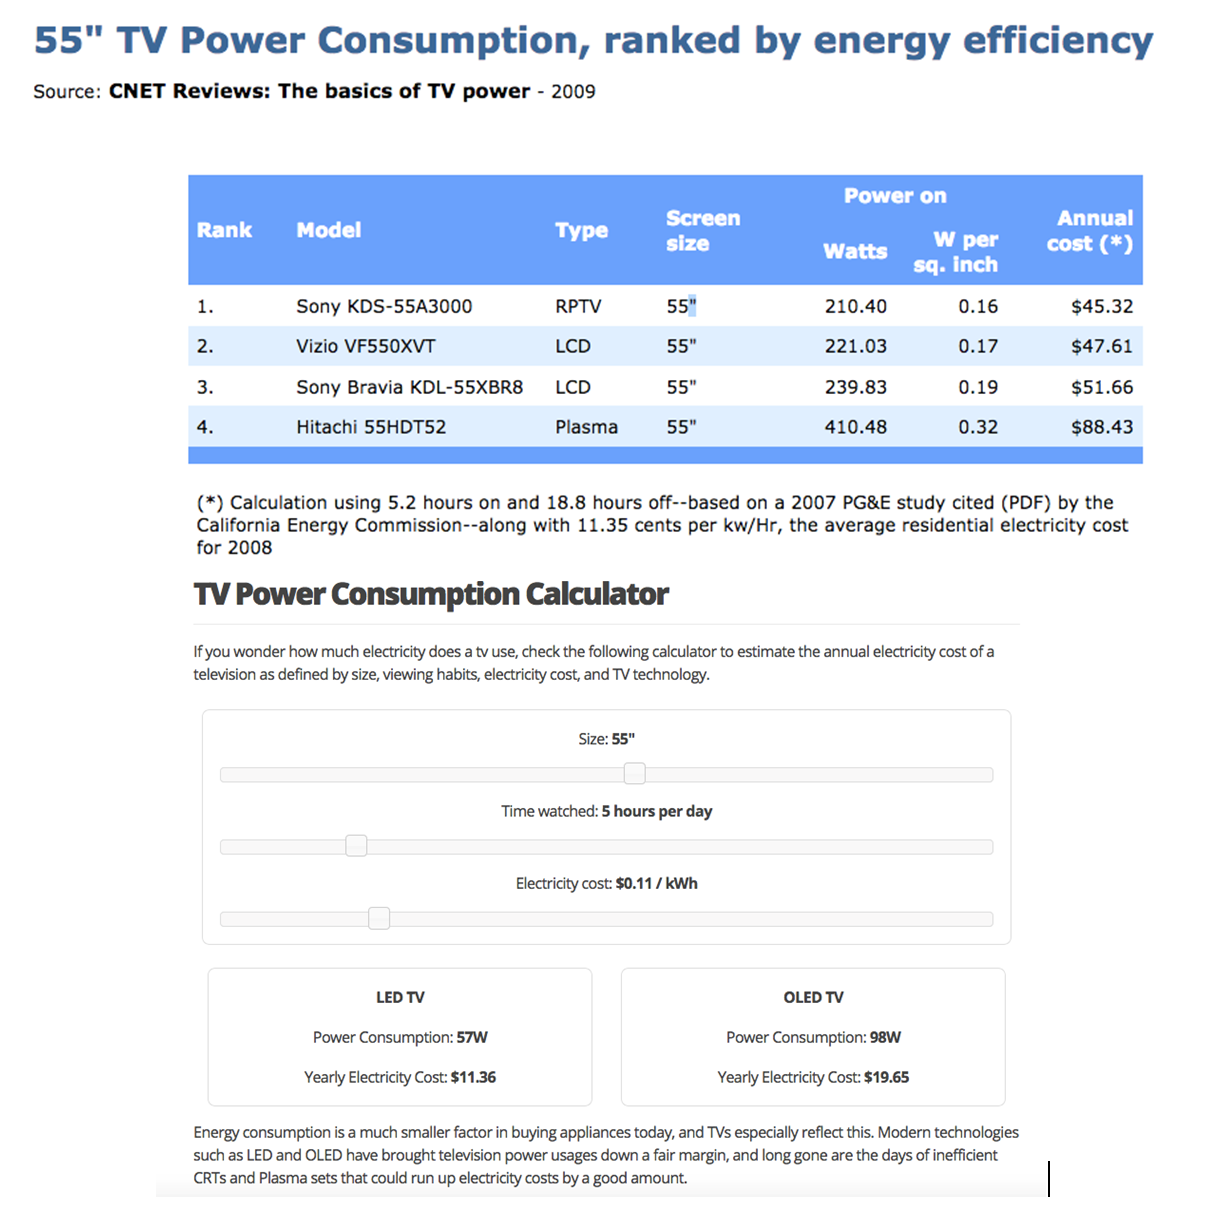
Let’s get back to displays. Without getting into the details, I just opened the box of a brand-new, but 10 year old, 42” Panasonic plasma television that I turned-on for the first time a couple of weeks ago. It worked perfectly well and looked good. I checked the specifications and found that the power consumption was 450 W. I actually felt the heat. Working in the display field, it was not a surprise, but it was a real experience. The following chart from 2009 shows the power consumption of various types of 55” television from RPTV, LCDTV, to Plasma showing that the plasma television consumed the most power. Please note that the same 55” LCDTV consumed about 230 W in 2009 and 57 W in 2017, which is a great improvement. This is a big step to energy conservation over the last 10 years. It also seems that we need to pay for image quality. The OLED television consumes 98 W, which is just less than twice the amount of LCD television power consumption of 57 W.
(Of course, the consumption of the PDP depends on the ABL of the image, whereas the power consumption of most LCDs is fixed, regardless of the image. Dr. Larry Weber did a lot of work on this some years ago, but the takeaway was that to really understand the power issues, you need to use test material, that he developed, rather than just looking at the label on the back which shows the peak power consumption. – Man. Ed.)
Besides the display screen, the other parts of the display system also take up power, namely, the image processors and the graphic chips. As in many game consoles and advanced high power graphic computers, the graphic chips can get very hot and most of them require cooling fans. Apple recently admitted that their older cell phones are being slowed down so that the battery would work “better” and solve the problem of random shutdown problem. TechCrunch explained that the issue is more likely to affect iPhones with older batteries, where sudden spikes of activity to the maximum power draw would trigger shutdowns.
The displaying of graphics with higher resolutions is one of the many activities that would take up more processing power, thus having higher chances of producing such spikes. I actually noticed the slow down in my iPhone 6 Plus for a little, while without knowing why. I wrote an article in Display Daily a couple months ago (What Improvements Really Matter and to Whom? Does Price Matter?) claiming that I would not upgrade my phone and the newer ones are very much the same as what I have. Knowing this slow down, I might change my mind. And then, I read this.
“The iPhone 6 is among the phones that Apple’s software updates slowed down. IPhone owners from several states have filed at least nine class-action lawsuits against Apple Inc. for not disclosing sooner that its software updates deliberately slowed down older-model phones so batteries would last longer.”
The world is changing too quickly. It could be that Einstein’s Relativity Theory applies to technological progress as well. I guess I will have to wait it out again and see what the courts have to say and whether my iPhone 6 Plus will speed up after the next update of the iOS. I think I am at the tangent now from display to battery and then to ………… and I think I should stop.
If you have any comments or questions, please direct them to Kenneth Li at [email protected]