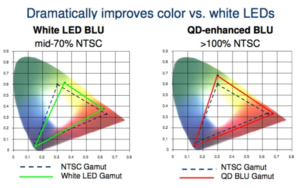
The many reports of Quantum Dots (QD) saving LCD TVs from the emergence of AMOLEDs tend to superficially use the extended color space and the higher luminance of LCDs as their key arguments. There is no question that QDs have improved the performance of LED-backlit LCD TVs and the increased use of QDs is a very good measure of their acceptance by the consumer base. The next figure shows the improvement of QDs. vs. phosphor based LEDs pushing the color width from 70% of NTSC to >100% of NTSC.

Figure 1 Effect of QD on Color Gamut — Source: QD Vision, OLED-A
While the use in percentage of a color space provides a relative measure of performance, it doesn’t really speak to the color validity of a particular display, as display and standards guru, Bob Myers recently commented:
“Wider gamuts don’t make for better color accuracy – they only expand the range of colors that can be accurately displayed, and then only IF everything else is done correctly. Until there’s source material produced to one of the wide-gamut standards (Rec. 2020 or DCI-P3 – probably 2020 for TV use, since the P3 gamut is so cinematic-projector-centric) a wide-gamut display is always going to do more poorly than one whose native gamut precisely matches the correct color standard for the source material (and right now that’s 709 for almost everything) – at least in terms of color accuracy. Nor do these wider-gamut displays provide “colors the human eye [has] never seen before” – the full range of human color vision can’t be completely covered by ANY physically-realizable three-primary system, although in practical terms 2020 does come close enough. Don’t get me wrong, I’m by no means saying that wider-gamut displays (and standards) are a bad thing, but simply having more saturated primaries in the display device is only part of the correct solution (and clearly can make things worse if the other parts of that solution aren’t present).”
Expressing color gamut in terms of simple 2-D area comparisons; such as how much “percent larger” one is when compared with another are practically meaningless, and are only valid in one particular color space in the first place.”
In keeping with the difficulty of measuring the full range of human color vision, a combination of characteristics including ambient conditions, luminance, contrast ratio and color accuracy measure the absolute level of perception as defined in CIECAM02 and called “brightness”. A description of this standard is called Perceptual Contrast Measurement (PCL) as described in SID 10 Digest . This measurement developed by Samsung shows that OLEDs with both extraordinary CR and color accuracy are perceived as typically having twice the brightness of LCDs with the same luminance. Moreover, high end LCD TVs use local dimming either with direct backlighting from behind the display or from the edge to enhance the contrast ratio. Local dimming improves the CR by reducing the luminance to areas of the display that require low luminance. Local dimming and “brightness” have a substantial impact of what the user perceives when watching an HDR embedded TV. To compare an OLED with a QD enhanced LCD using HDR, one must first look at the specs. Below is a table (accurate as of June 2016) listing the key differences between Dolby Vision and HDR-10 standards:
Table 1 HDR Standards
| HDR10 | Dolby Vision | |
| Standard: | Open | Proprietary |
| Peak Luminance: | Up to 4,000 cd/m² | Up to 10,000 cd/m² |
| Video Bit Depth: | 10-bit | Up to 12-bit |
| Metadata: | Static (per title) | Dynamic (scene-by-scene) |
| Software Upgradability: | Yes | No (SoC hardware-embedded) |
| TV Brands: | LG, Panasonic, Samsung, Sony, etc | LG, Vizio (US) |
| Delivery Medium: | Ultra HD Blu-ray, Netflix, Amazon | Netflix, VUDU (US) |
Source: Vincent Teoh, HDTV Test
At first glance, these two standards challenge OLEDs, since the LG OLED TVs currently have a peak luminance of 540 cd/m²: 13.5% of HDR10 and 5.4% of Dolby Vision. OLEDs could reach higher luminance levels but clearly with a trade off of lifetime. However, even the latest Samsung TV, the Series 9 SUHD TV, does not meet these specs since it has a peak luminance of 1000 cd/m².
To evaluate the performance of the two HDR-enabled TVs, first consider the effect of perceived brightness, which puts the OLED TV at 1,080 cd/m² (2x the specified luminance as shown by the Samsung research quoted above) and second consider the use of local dimming. When showing a locally dimmed image – say, fireworks – where the cinematographer wants to increase the luminance, the image would have a very bright section surrounded by a very dark section (the night). In order to achieve the black portion, the dimming electronics lowers the luminance in the area containing both the dark and super bright image so the effect is a lower luminance than specced. For example, when the peak luminance is less than 1% APL, QD LCDs lower the luminance markedly to maintain the black level. QD LCDs typically meet UHDA patterns but are challenged to meet spec for HDR patterns and HDR Blu-ray titles, while OLEDs always meet the specs.
As a result, even in the case where the LCD TV has ~2X the luminance of the OLED, the actual image on the OLED is perceived by the viewer to be brighter and with higher contrast as shown in the next figure.
 Figure 2 Local Dimming Effect on QD/LCD vs. OLED TV — Source: LG Display, OLED-A
In Figure 2, luminance values were measured at the peak area and the input values of the peak regions are all over 1,000 cd/m². If an HDR display is capable of 4,000 cd/m², the output peak luminance of the region would reach over 1,000 cd/m². In the case of the QD LCD HDR TV, even though its maximum peak luminance is over 1,000 cd/m², the measured output peak luminance values in the peak region of the commercial HDR contents does not reach 1,000 cd/m². However, in case of the OLED HDR TV, the measured luminance values do reach its maximum peak luminance value.
QD LCDs are also constrained when trying to realize HDR by:
- Decrease in white luminance over time
- Decrease in white luminance for moving patterns
- Loss of luminance at wide viewing angles
- Inability to reach max luminance for small areas
- Impact of background images on pure black
For example, below are luminance measures from typical movie’ content when shown on an HDR TV.
Table 2 UHDA Spec (APL) for HDR Content
| HDR Source | Film BH | Film A | Film SM | Film S | ||||
| Category | OLED | QD LCD | OLED | QD LCD | OLED | QD LCD | OLED | QD LCD |
| Peak White (lm) | 610 | 640 | 540 | 420 | 555 | 480 | 620 | 620 |
Source: LG Display
UHD Spec: OLED (>540 cd/m²) / LCD (>1000 cd/m²)
UHDA certified OLED 540 cd/m² equals to LCD 1000 cd/m²
“Seeing is believing” and that is why most if not all TV display critics choose HDR OLEDs over any HDR LCD TV including those with QD enhanced backlights.
Regarding the development on Perceptual Contrast Measurement (PCL) as a standard, Samsung Display did the work, although the company is no longer pushing the use of PCL for obvious reasons. – Barry Young
Barry Young is the Managing Director of the OLED Association and is on the board of Ignis Innovations. He was an SVP at DisplaySearch from 1995 to 2007.