Samsung Electronics was at the CE Week event in New York City showcasing their new HDR calibration disc along with a complete UHD/HDR calibration workflow featuring the CalMan software from SpectraCal. The disc and accompanying instruction manual won’t be ready for distribution for a couple of months, but the demo provided a great preview of this compelling offering.
The HDR calibration disc was developed by AVTOP’s founder, Florian Friedrich with support from Samsung. Friedrich then worked with Kevin Miller, an ISF-certified calibrator, to develop the calibration workflow. The disc includes a number of tests with test images that were specifically developed for HDR UHD TVs (you can’t use Standard Dynamic Range test patterns as the levels are completely different). The CalMan software provides a handy way to collect and analyze the data. Calibrators will need a good spectroradiometer too.
The workflow is designed to first evaluate the TV in various modes (out of box, cinema, sports, etc.) to understand the performance of these modes. Then, there is a calibration procedure to optimize performance, if necessary, and save as a custom setting.
In the demo, we saw many of these measurements demonstrated. This included measurement of peak luminance, black level, color gamut and white point. The manual also provides instructions for additional tests like black level/brightness adjustment, contrast adjustment, color adjustment, sharpness adjustment, clipping and tone mapping test, image over enhancement tests (chroma and luminance), panel resolution test and more.
Note that these tests and test materials were developed by Samsung and validated on Samsung TVs, but they can be applied to any UHD HDR TV. Samsung plans to offer these tools to the industry for free as they are desperately needed by calibrators, retailers, integrators and end customers.
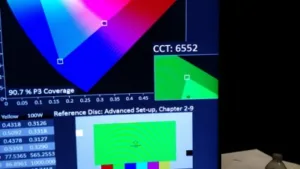
One of the tests we witnessed was the peak luminance measurement. This is done with four different patterns featuring a full white patch in an all black background. This patch varied from 10% to 25% to 50% and 100% of the area of the display. The peak luminance of all HDR displays decreases as this “loading” factor increases. In the case of the Samsung set, the luminance changed from around 1200 cd/m² for the 10% patch to about 500 cd/m² for the full white screen (100% patch).
There is no agreement on how peak luminance should be measured yet, but these data points provide a good profile of how the display will perform based on the percentage of bright highlights in the scene.
You would be surprised how much area a 10% patch is. It was much bigger than I thought and would have judged it as closer to 25% of the screen area (see photo). That means having peak luminance in only a 10% patch is actually pretty good for a lot of HDR content.
But this is also tied to the Average Picture Level (APL) of the content. A dark scene with a low APL can have a fairly large area of very bright highlights and still create an impactful image with lesser performing HDR displays. But a scene with a high APL, such as snow scenes, may not be able to raise the highlights much above this already bright scene.
Samsung showed one content scene of ocean waves with a lot of white foam that was able to show bright sparkles in the waves quite well. They noted that other HDR displays – we presume they were referring to OLED HDR TVs – could not show these sparkles. These TVs can have a 100% white patch luminance of only 150 cd/m², so they don’t have the luminance headroom to create the bright sparkles, was their point.
We also looked at black level measurements that are done with two test patterns. One is a series of concentric circles from black to dark gray and the other is a black screen with white patch in the corners (patches are 1% by area). Friedrich noted that many of their test patterns include some movement. This is done to ensure the TV is in a video mode since some TVs will adjust the contrast based on the APL, which can change the peak luminance or black level measurement. Testers may not be aware of this.
Color performance was next with RGB and CYM points captured and instantly displayed on a xy CIE chart. Calibrators are able to then go in and adjust RGBCYM color point to bring the performance with the desired target points, indicated with a small square on the chart. This can be done at various luminance levels as well. If all this data is then exported, a three dimensional color volume model of the color volume can be built and displayed. This is not part of the toolkit now, but may be considered for later.

Samsung and partners have invested considerable effort to develop these tools and we applaud their making these available to the industry as it will help everyone involved in testing and evaluating HDR displays. -CC