
BOE reported revenue of approximately $24.44 billion, marking a slight decline of 2.17% from the previous year. The company’s net profit attributable to shareholders was about $356.58 million, experiencing a significant drop of 66.22% year-on-year. The company still has a strong balance sheet and it seems to be committed to investing in its core display business, claiming over 2.563 billion yuan ($354 millions) pumped into research and development and a deep well of patents in flexible OLEDs.
However, the Display Devices segment of BOE generated roughly $20.59 billion in revenue, a minor decrease of 2.06% from the prior year, with a gross profit margin of 9.17%, slightly improving by 0.88%. BOE’s Internet of Things (IoT) business saw a revenue of about $5.45 billion, up 13.30%, and a gross profit margin of 9.28%, an increase of 2.16%.
The company’s sensing business brought in approximately $56.7 million in revenue, reflecting a substantial growth of 32.13%. Meanwhile, the MLED business achieved a revenue of around $406.28 million, marking an impressive 81.42% increase. The smart medical industry segment reported revenue of nearly $390.88 million, growing by 26.71%.
| Fiscal Year ending Dec. 31 | Net Sales (million CNY) | Net Income (million CNY) |
| 2018 | 97,109 | 3,435 |
| 2019 | 109,160 | 1,919 |
| 2020 | 116,060 | 5,036 |
| 2021 | 135,553 | 25,831 |
| 2022 | 178,414 | 7,551 |
| 2023 | 174,543 | 2,547 |
| Year | Net Sales (million of dollars) | Net Income (millions of dollars) |
| 2018 | 13,595 | 481 |
| 2019 | 15,282 | 269 |
| 2020 | 16,248 | 705 |
| 2021 | 18,977 | 3,616 |
| 2022 | 24,978 | 1,057 |
| 2023 | 24,436 | 357 |
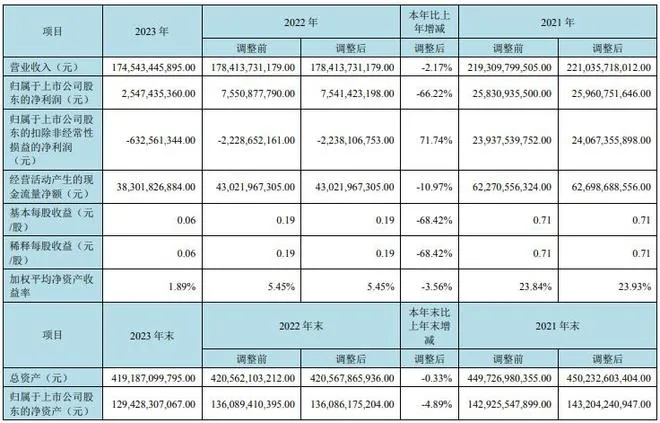
| Simplified English Translation | Year 2023 | Year 2022 | Year 2021 | Year-on-Year Change 2022-2023 |
|---|---|---|---|---|
| Operating Income (Yuan) | 174,543,445,895.00 | 178,413,731,179.00 | 219,309,799,505.00 | -2.17% |
| Net Profit Attributable to Listed Company’s Shareholders (Yuan) | 2,547,435,360.00 | 7,550,877,790.00 | 25,830,935,500.00 | -66.22% |
| Net Profit Attributable to Listed Company’s Shareholders After Deducting Non-Recurring Gains and Losses (Yuan) | –632,561,344.00 | -2,228,652,161.00 | 23,937,539,752.00 | 71.74% |
| Cash Generated from Operating Activities/Net Cash Flow (Yuan) | 38,301,826,884.00 | 43,021,967,305.00 | 62,270,556,324.00 | -10.97% |
| Basic Earnings Per Share (Yuan/Share) | 0.06 | 0.19 | 0.71 | -68.42% |
| Diluted Earnings Per Share (Yuan/Share) | 0.06 | 0.19 | 0.71 | -68.42% |
| Weighted Average Net Asset Return Rate | 1.89% | 5.45% | 23.84% | -3.56% (from 5.45% to 1.89%) |
| Total Assets (Yuan) | 419,187,099,795.00 | 420,562,103,212.00 | 449,726,980,355.00 | -0.33% |
| Net Assets Attributable to Listed Company’s Shareholders (Yuan) | 129,428,307,067.00 | 136,089,410,395.00 | 142,925,547,899.00 | -4.89% |