Worldwide spending on augmented reality and virtual reality (AR/VR) is forecast to be $18.8 billion in 2020, an increase of 78.5% over the $10.5 billion International Data Corporation (IDC) expects will be spent in 2019.
The latest update to IDC’s Worldwide Augmented and Virtual Reality Spending Guide also shows that worldwide spending on AR/VR products and services will continue this strong growth throughout the 2019-2023 forecast period, achieving a five-year compound annual growth rate (CAGR) of 77.0%.
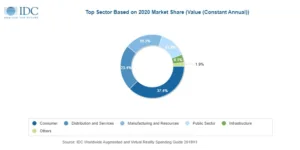
Worldwide spending on AR/VR solutions will be led by the commercial sectors, which will see its combined share of overall spending grow from less than 50% in 2020 to 68.8% in 2023. The commercial industries that are expected to spend the most on AR/VR in 2020 are retail ($1.5 billion) and discrete manufacturing ($1.4 billion). Fifteen industries are forecast to deliver CAGRs of more than 100% over the five-year forecast period, led by securities and investment services (181.4% CAGR) and banking (151.9% CAGR). Consumer spending on AR/VR will be greater than any single enterprise industry ($7.0 billion in 2020) but will grow at a much slower pace (39.5% CAGR). Public sector spending will maintain a fairly steady share of overall spending throughout the forecast.
“AR/VR commercial uptake will continue to expand as cost of entry declines and benefits from full deployment become more tangible. Focus is shifting from talking about technology benefits to showing real and measurable business outcomes, including productivity and efficiency gains, knowledge transfer, employee’s safety, and more engaging customer experiences,” said Giulia Carosella, research analyst, European Industry Solutions, Customer Insights & Analysis.
Commercial use cases will account for nearly half of all AR/VR spending in 2020, led by training ($2.6 billion) and industrial maintenance ($914 million) use cases. Consumer spending will be led by two large use cases: VR games ($3.3 billion) and VR feature viewing ($1.4 billion). However, consumer spending will only account for a little over one third of all AR/VR spending in 2020 with public sector use cases making up the balance. The AR/VR use cases that are forecast to see the fastest growth in spending over the 2019-2023 forecast period are lab and field (post secondary) (190.1% CAGR), lab and field (K-12) (168.7% CAGR), and onsite assembly and safety (129.5% CAGR). Seven other use cases will also have five-year CAGRs greater the 100%. Training, with a 61.8% CAGR, is forecast to become the largest use case in terms of spending in 2023.
Hardware will account for nearly two thirds of all AR/VR spending throughout the forecast, followed by software and services. Services spending will see strong CAGRs for systems integration (113.4%), consulting services (99.9%), and custom application development (96.1%) while software spending will have a 78.2% CAGR.
“Across enterprise industries, we are seeing a strong outlook for standalone viewers play out in use case adoption. Enterprises will drive much of these high-end headset adoption trends. In the consumer segment, more affordable viewer models for gaming and entertainment purposes will see the broadest industry adoption,” said Marcus Torchia, research director, Customer Insights & Analysis.
Of the two reality types, spending in VR solutions will be greater than that for AR solutions initially. However, strong growth in AR hardware, software, and services spending (164.9% CAGR) will push overall AR spending well ahead of VR spending by the end of the forecast.
On a geographic basis, China will deliver the largest AR/VR spending total in 2020 ($5.8 billion), followed by the United States ($5.1 billion). Western Europe ($3.3 billion) and Japan ($1.8 billion) and will be the next two largest regions in 2020, but Western Europe will move ahead of China into the second position by 2023. The regions that will see the fastest growth in AR/VR spending over the forecast period are Western Europe (104.2% CAGR) and the United States (96.1% CAGR).
The Worldwide Augmented and Virtual Reality Spending Guide examines the augmented reality and virtual reality (AR/VR) opportunity and provides insights into this rapidly growing market and how it will develop over the next five years. Revenue data is available for nine regions, 20 industries, 47 use cases, and 6 technology categories and two reality types. Unlike any other research in the industry, the comprehensive spending guide was created to help IT decision makers to clearly understand the industry-specific scope and direction of AR/VR expenditures today and in the future.

