
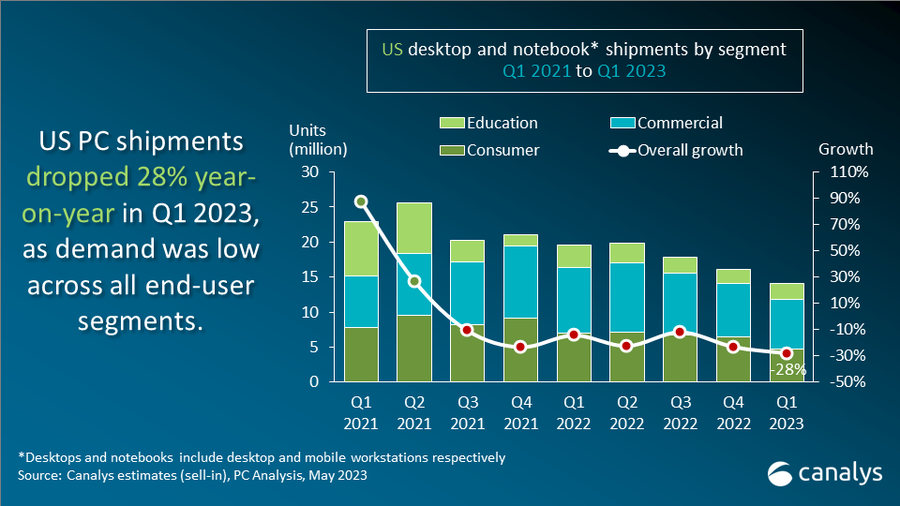
The first quarter of 2023 saw a significant decline in PC shipments in the United States, with a 28% YoY drop to 14.0 million units. This included both notebooks and desktops, with notebook shipments falling 31% to 11.4 million units, and desktop shipments decreasing 28% to 2.7 million units. However, tablet shipments held relatively steady, with a smaller 7% decline to 10.8 million units, driven largely by strong sales of Apple’s iPad.
According to Ishan Dutt, Principal Analyst at Canalys, the drop in PC market sales in early 2023 was influenced by several factors. These included seasonal trends post-holidays, inventory corrections, and economic pressures on businesses such as multiple interest rate hikes. As a result, many businesses have opted to extend the life cycle of their existing PCs or limit upgrades to critical ones only.
However, there is a sense of optimism for the market going forward. Canalys predicts that by Q4’23, US PC shipments will see a year-on-year growth of 6%, and full-year shipments in 2024 are expected to be 13% higher than in 2023. Key factors expected to drive this growth include a drop in inflation, improvements in business sentiment, a potential boost from the education sector, and an anticipated transition away from Windows 10 to Windows 11 in 2024.
US Desktop and Notebook Shipments
| Company | Q1’23 Shipments (‘000) | Q1’23 Market Share | Q1’22 Shipments (‘000) | Q4’22 Market Share | YoY Growth |
|---|---|---|---|---|---|
| Dell | 3,801 | 27.1% | 5,147 | 26.3% | -26.2% |
| HP | 3,733 | 26.6% | 4,298 | 22.0% | -13.2% |
| Lenovo | 2,119 | 15.1% | 3,263 | 16.7% | -35.0% |
| Apple | 1,715 | 12.2% | 2,671 | 13.7% | -35.8% |
| Acer | 787 | 5.6% | 1,104 | 5.7% | -28.7% |
| Others | 1,890 | 13.5% | 3,070 | 15.7% | -38.5% |
| Total | 14,045 | 100.0% | 19,553 | 100.0% | -28.2% |
US Tablet Shipments
| Company | Q1’23 Shipments (‘000) | Q1’23 Market Share | Q1’22 Shipments (‘000) | Q1’22 Market Share | YoY Growth |
|---|---|---|---|---|---|
| Apple | 5,404 | 50.0% | 4,484 | 38.6% | 20.5% |
| Amazon | 2,041 | 18.9% | 2,747 | 23.7% | -25.7% |
| Samsung | 1,765 | 16.3% | 2,197 | 18.9% | -19.6% |
| TCL | 602 | 5.6% | 596 | 5.1% | 0.9% |
| Microsoft | 375 | 3.5% | 539 | 4.6% | -30.4% |
| Others | 625 | 5.8% | 1,041 | 9.0% | -40.0% |
| Total | 10,812 | 100.0% | 11,604 | 100.0% | -6.8% |