
David Barnes always has a good angle in his talks. This year, his swansong as he has gone into retirement, he talked about the “Slinky business” and had a “slinky” metal toy moving from hand to hand as he spoke!
He sees the industry going through cycles – as IGZO has done, for example – The cycle starts with “it’s great”, then “it’s not so good”, “it’s finally here” and then “oh, the money has gone….”. The cycle can go through multiple loops and iterations.
Looking back at PDP there was a loop through from DC to AC PDP, resolutions went from 480 to 720 to 1280. Digital Photo Frames went through a rise and fall from hot new product to unused presents! Colour filters made with inkjets was another cycle. There are product cycles, technology cycles and economic cycles.
Taking a five year snapshot, there have been a lot of changes, but eventually it “all became AMLCD” after being dominated by CRTs for many years. In the 70s and 80s, the SID was dominated by phosphors and CRTs.
Now AMLCD is 97% of the area and 98% of the value of the market. Where did the value go?
Turing to purchasing power dollars, LCD TVs went from $900 per sq. ft. Prices have fallen very, very fast (he said from $900 to $3 per sq ft????)
Panel makers have moved from open cell business but this hasn’t radically changed the business models.
If you plot first new substrate sizes, the S curve is very clear. The capacity increase is the big factor in reducing prices this year.
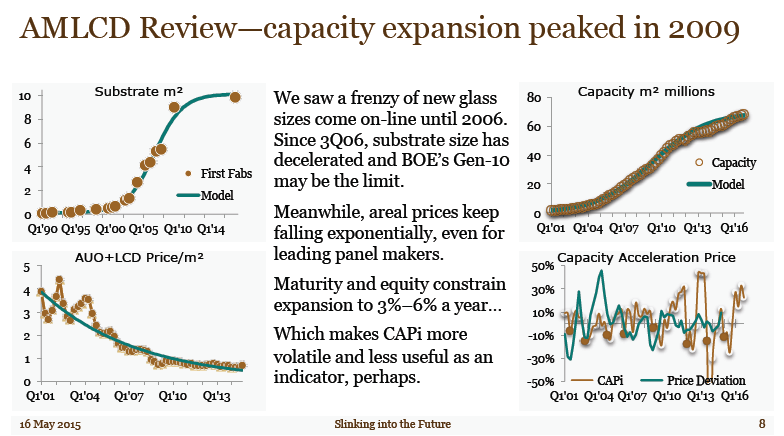 The substrate size chart, top left is a clear “S” curve
Diversity has changed and panel makers have learned to “slice and dice” their capacity different ways. To use a phrase that Barnes used a few years ago, LCD fabs are “fungible”; that is to say, the factories can all basically make most types of LCD, so if one becomes particularly profitable, that situation doesn’t last long. Turning to the Herfihndal index, a measure of the competitive structure of the industry (and a particular favourite of mine – Man. Ed.) this has changed a lot over the years from 1999 to 2014. Everybody is now trying to find a niche.
Taiwan is always an interesting subject for study, there is so far a transfer of $11 billion from investors in the LCD business to staff and consumers. The same is broadly true for Japan.
Looking at AUO and LGD, they have finally come above zero to get to a net positive cash flow, but they may invest again and that would drive the result negative again.
IGZO turned out to be harder than expected, but OLED may yet get exciting because of flexible applications, but EPD is a disappointment. Where next, Barnes asked – maybe QDs or other architectures? Where does the money for this come from for more investment? You could adopt a JV approach. You could look at Apple-style supply agreements. Could there be more state-sponsored companies?
Finally, you could go back to a CRT model, where you can bring money in as long as you can bring in enough money to cover the variable costs.