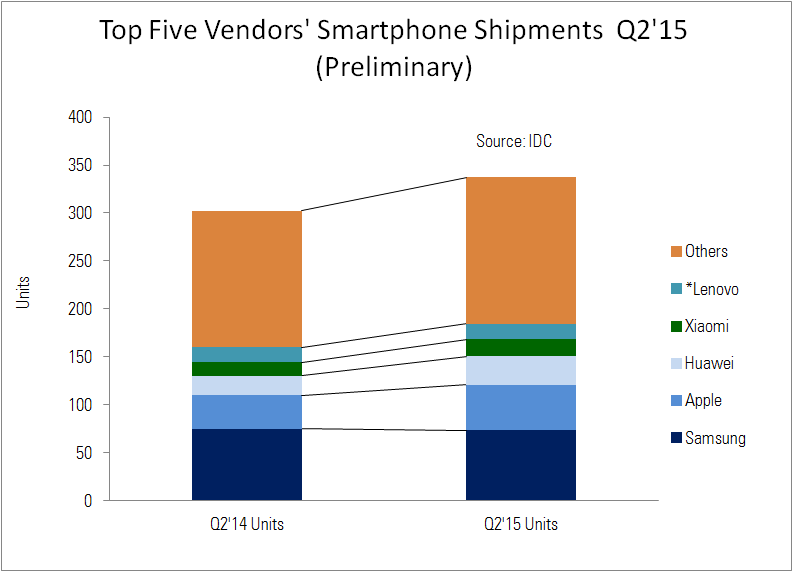
IDC released its preliminary data on the smartphone market in Q2 by highlighting that it’s the growth in emerging markets that is driving the market. In total, 337.2 million smartphones were shipped, up 11.6% from 302.1 million in Q2 2014, the second highest quarterly total on record. For all phones, the total was 464.6 million, down -0.4% from Q2 last year.
Premium handsets sold well in the developed world, but it is “the abundance of affordable handsets that continue to drive shipments in many key markets,” said Anthony Scarsella, Research Manager of IDC’s Mobile Phone team. Smartphones are replacing feature phones in the market.
New brands continue to come into the market and IDC is now tracking 200 brands globally (although Apple and Samsung dominate with 35.8% between them).
Samsung remained at the top of the list of brands, but lost some share to Apple and also was the only one of the top five brands to lose volume on a year on year basis (-2.3%). IDC said that limited supply of the Galaxy S6 Edge was part of the problem, but thinks that the rumoured Note 5 and S6 Edge Plus might have a positive impact from Q3.
Apple had a good quarter, with 47.5 million phones shipped, with dominance in the Chinese market a factor, where the larger screen models are popular. IDC expects refreshed “S” models to appear in Q3 to boost demand.
Huawei did well in Europe and that put it into third spot and meant 48.1% year on year growth. The mid-range and high end models did well and IDC thinks that Huawei will expand into the US with a new unlocked P8 Lite model that will sell for just $250.
Xiaomi continues to do well in China, and it made 29.7% growth, with success at both ends of the market. It will boost its IP portfolio and start to expand geographically, initially into Brazil.
Lenovo rounds out the top five boosted by success in India and with the Motorola brand in the Americas and Europe.

|
Top Five Smartphone Vendors – Worldwide Shipments, Market Share, and Year-Over-Year Growth, Q2 2015 Preliminary Data (Units in Millions) |
||||||||||
| Vendor |
2Q15 |
2Q15 Market |
2Q14 |
2Q14 Market |
Year-Over- |
|||||
| Samsung | 73.2 | 21.7% | 74.9 | 24.8% | -2.3% | |||||
| Apple | 47.5 | 14.1% | 35.2 | 11.7% | 34.9% | |||||
| Huawei | 29.9 | 8.9% | 20.2 | 6.7% | 48.1% | |||||
| Xiaomi | 17.9 | 5.3% | 13.8 | 4.6% | 29.4% | |||||
| *Lenovo | 16.2 | 4.8% | 15.8 | 5.2% | 2.4% | |||||
| Others | 152.5 | 45.2% | 142.2 | 47.1% | 7.3% | |||||
| Total | 337.2 | 100.0% | 302.1 | 100.0% | 11.6% | |||||
| Lenovo + Motorola | 16.2 | 4.8% | 24.3 | 8.0% | -33.3% | |||||
|
Source: IDC Worldwide Quarterly Mobile Phone Tracker, July 23, 2015 |
||||||||||

