Nameplate or unyielded capacity is the most common, but often least useful way to look at OLED capacity. In LCDs, it is more acceptable to focus on unyielded capacity as yields are in a relatively tight range. However, in OLEDs, yields span a wide range. So, yielded capacity is a better snapshot of a company’s production capability.
Fortunately, DSCC examines yielded OLED capacity in its Quarterly OLED Supply/Demand and Capital Spending Report. We apply yield estimates to every fab by phase by quarter. We are able to capture yields in our Quarterly Mobile LCD and OLED Fab Utilization Report as we know how much glass is going in and how many panels are shipping. We recently put all the yields in a pivot table that allows users to sort yielded capacity and yield results on a quarterly or annual basis, by manufacturer, by application, by substrate (flexible, rigid or foldable) etc. We also look at capacity conversion ratios which takes into account not only yields, but also lost area associated with panelization, handling margins, cutting margins, etc. It is truly a wealth of information on OLED capacity. Some of the highlights include:
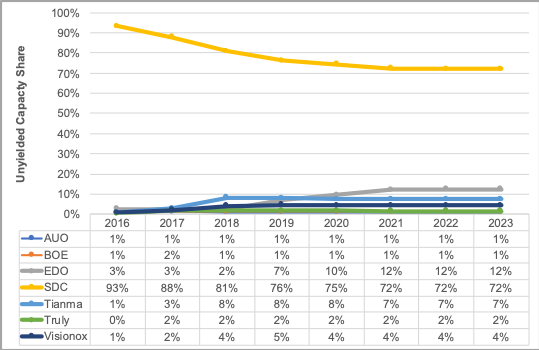
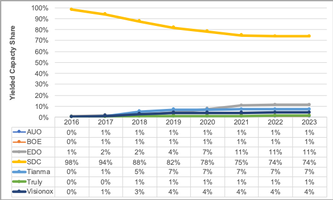
- Samsung Display’s (SDC’s) flexible OLED yielded capacity share in 2019 is 76% vs. 64% on an unyielded basis. This is a result of its much higher yields than the rest of the industry.
- Conversely, BOE and LGD each have unyielded capacity of 13% in 2019, but their yielded capacity is expected to be 10% and 11% respectively.
- By 2023, the flexible OLED unyielded and yielded capacity share gaps should narrow as other manufacturers’ yields approach SDC’s.
- SDC’s yielded flexible OLED capacity advantage should shrink from 76% to 11% in 2019 to just 28% to 27% in 2023 if it chooses not to invest through 2022 as currently expected. We also expect SDC to shift some capacity to foldable which we count separately. We also expect SDC to shift some capacity to Y-OCTA or at least have some capacity serve a dual purpose as OLED or Y-OCTA. In addition, next quarter we will reflect the impact of SDC’s LTPO capacity conversions which will result in a small loss of capacity as explained in another article this issue.
- Flexible OLED yielded capacity is expected to grow from 344M in 2018 to 798M in 2023, a 132% increase.
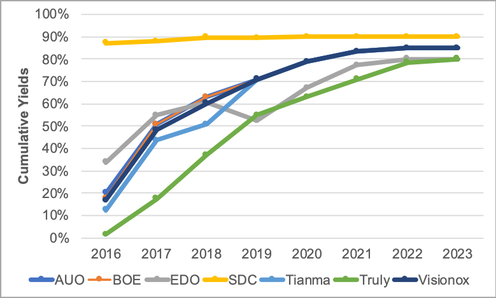
- The report shows significant yield improvements outside of SDC. How are companies doing this? In the case of at least one supplier, we see them running their fabs slower, at lower capacity to improve yields. For example, by running the FMM VTE equipment slower, they can clean the process chambers and FMMs more frequently, ensuring a lack of cross contamination and color mixing, etc. Once they figure out how to maximize yields at slower throughputs, they will then look to run those lines faster, at higher output, without a drop-off in yields. We believe cleaning the process chambers and FMMs frequently is a significant part of yield improvements and believe SDC has done this at a higher rate than others until now.
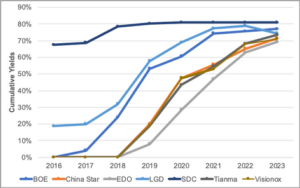
- Yields by supplier are shown below on an annual basis. As indicated, SDC is leading the industry with a wide advantage today at over 80%, which should narrow over time as other panel manufacturers learn to improve flexible OLED yields. Yields may dip for a company as they ramp new capacity as shown in the case of LGD in 2023.
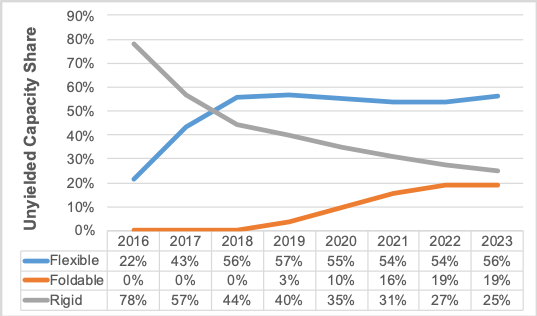
Unyielded vs. Yielded Flexible OLED Capacity Share
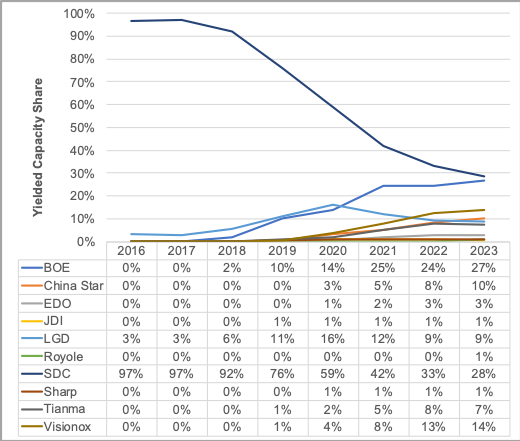
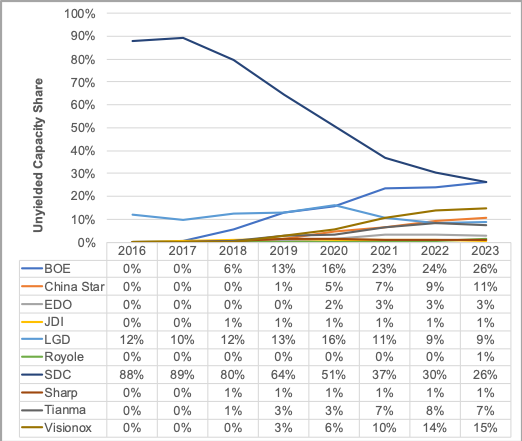
Source: DSCC’s Quarterly OLED Supply/Demand and Capital Spending Report
Cumulative Flexible OLED Yields by Supplier
Source: DSCC’s Quarterly OLED Supply/Demand and Capital Spending Report
How about foldable? In the case of foldable, we don’t see a lot of dedicated capacity allocations yet, but that will change in the future. We do believe 4 companies are planning to dedicate capacity to foldable in the future including SDC, BOE, Royole and LGD. Of course, we are aware of Visionox and China Star winning foldable business, but not enough to truly dedicate a line at this point. In any case, we show SDC dominating with its yielded capacity share significantly higher than its unyielded capacity share as one would expect given the complexity of making foldable OLEDs. In 2019, we show its yielded capacity share at 86% vs. its unyielded capacity share at 55% as we believe its yields will be significantly higher than those of BOE’s and Royole’s for the year. However, by 2023, others are expected to close the gap and its yielded capacity share will fall to 47% with BOE at 30% and LGD at 20%. Foldable yields are lower than flexible yields and will stay that way over the forecast, but the difference will narrow over time as volumes increase and materials improve. The significant improvements in foldable yields will be critical in bringing down costs and prices and increasing volume. We show dedicated foldable yielded capacity rising to 87M panels in 2023 from 5M in 2019.
Unyielded vs. Yielded Foldable OLED Capacity Share
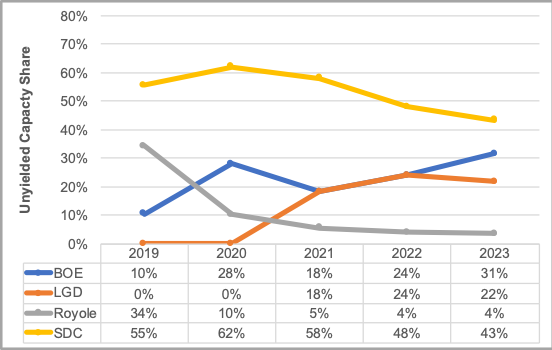
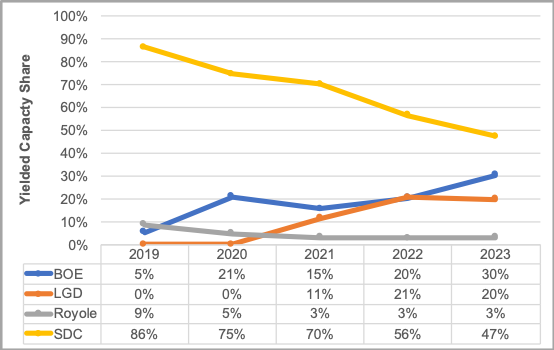
Source: DSCC’s Quarterly OLED Supply/Demand and Capital Spending Report
Foldable OLED Cumulative Yields by Supplier
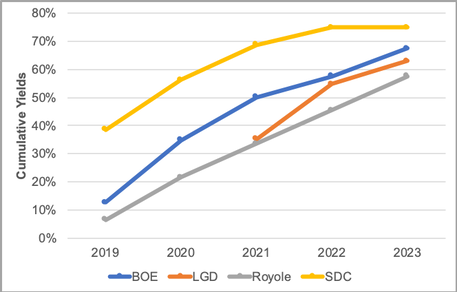
Source: DSCC’s Quarterly OLED Supply/Demand and Capital Spending Report
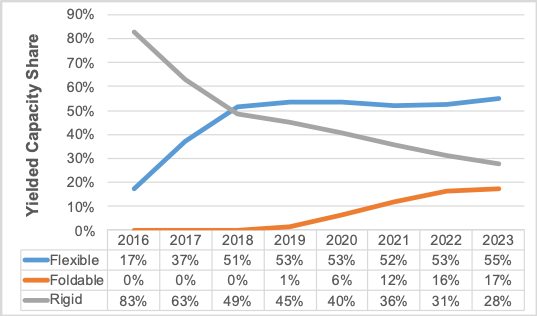
How about rigid? It is important not to exclude rigid as rigid is expected to occupy at least 40% of the mobile OLED market on a yielded basis through 2020 and still maintain a 28% yielded share in 2023. On an unyielded basis, its share is quite a bit below its unyielded share since rigid yields are higher than flexible and foldable. By supplier, Samsung is expected to maintain an even more dominant share in rigid OLEDs with a 74% share on a yielded basis in 2023 and just a modest decline from 82% in 2019 as BOE, Visionox, China Star and others focus on flexible OLEDs. Rigid yields are highest among mobile OLED panels due to not having to deposit polyimide, remove the polyimide panel from the glass carrier and manage a flexible panel in the module process. As shown, rigid yields will stay above flexible and foldable yields through the forecast. Yielded rigid OLED panel capacity is expected to rise from 408M in 2018 to 489M in 2023, just a 20% increase.
The overall mobile OLED yields won’t change that much as more lower yielding suppliers enter flexible and higher yielding flexible capacity moves to lower yielding foldable panels. So, mobile OLED yields are trending down from 80% to 75% and will then migrate back up to close to 80% again. For more information on the Quarterly OLED Supply/Demand and Capital Spending Report and our yield calculations, please contact [email protected].
Unyielded vs. Yielded OLED Capacity Share by Type
Source: DSCC’s Quarterly OLED Supply/Demand and Capital Spending Report
Unyielded vs. Yielded Rigid OLED Capacity Share
Source: DSCC’s Quarterly OLED Supply/Demand and Capital Spending Report
Rigid OLED Cumulative Yields by Supplier
Source: DSCC’s Quarterly OLED Supply/Demand and Capital Spending Report
Flexible vs. Foldable vs. Rigid Cumulative Yields
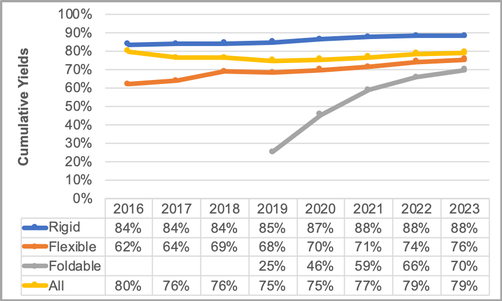
Source: DSCC’s Quarterly OLED Supply/Demand and Capital Spending Report