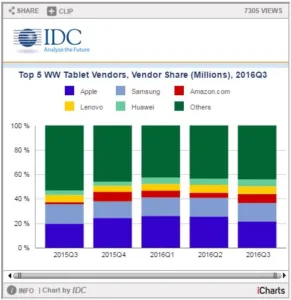
The worldwide tablet market continued its slump as vendors shipped 43 million units in the third quarter of 2016 (3Q16), a year-over-year decline of 14.7%, according to preliminary data from the International Data Corporation (IDC) Worldwide Quarterly Tablet Tracker. In contrast to the annual decline, 3Q16 shipments were up 9.8% over the second quarter of 2016 as the larger vendors prepared for the holiday quarter.
Low-cost (sub-$200) detachables also reached an all-time high as vendors like RCA flooded the market. “Unfortunately, many low-cost detachables also deliver a low-cost experience,” said Jitesh Ubrani, senior research analyst with IDC’s Worldwide Quarterly Mobile Device Trackers. “The race to the bottom is something we have already experienced with slates and it may prove detrimental to the market in the long run as detachables could easily be seen as disposable devices rather than potential PC replacements.”
“Beyond the different end-user experience delivered by low- and high-end tablets, we’re witnessing real tectonic movements in the market with slate companion devices sold at the low-end serving a broader platform strategy, like Amazon is doing with Alexa on its Fire Tablets, and more expensive productivity tools closer to true computing and legitimate notebook replacement devices that should manage to keep average prices up,” said Jean Philippe Bouchard, research director, Tablets at IDC.
Tablet Vendor Highlights
Despite Apple’s marketing push for the iPad Pro, the iPad Air and Mini lines have been the models with mass appeal, accounting for more than two-thirds of its shipments this quarter. Although Apple’s tablet shipments declined 6.2% year over year, total iPad-related revenues were flat for the quarter, thanks to the iPad Pro offering.
Samsung continued to hold the number 2 position. Fortunately, the negative press from the Note 7 did not bleed over into its tablet business. However, overreliance on the declining slate market led to a decline of 19.3% compared to 3Q15. Samsung’s attempt to enter the detachable market with its TabPro S at the beginning of 2016 seems to have taken a backseat as its price and positioning remain uncompetitive.
The Amazon Prime Day sale in early July led to a huge surge in shipments of its Fire tablets. The already low-priced device was offered at a 30% discount then, and continued to remain popular throughout the rest of the quarter. The new Fire HD 8 released in early October will likely perform well in the holiday quarter as it follows Amazon’s strategy of selling low-cost tablets as a gateway and companion to its ecosystem. It is important to note that Amazon’s unprecedented growth is partially attributed to the fact that IDC did not include the 6-inch tablets offered by Amazon in 3Q15.
Lenovo continued to maintain its stronghold in Asia/Pacific (excluding Japan) as well as Europe, Middle East and Africa (EMEA). Though the company has many aspirational products across all its entire consumer electronics portfolio, none were enough to raise the company’s profile in the tablet market, resulting in a 10.8% decline this quarter. While the latest Yoga Book announced at IFA garnered some praise, it is important to note that IDC will be counting this as a traditional PC.
Huawei’s strong presence in the adjacent smartphone market and overall brand recognition has cascaded into the tablet market. The vendor offers a very strong value proposition as many of its tablets (over two-thirds) come integrated with cellular connectivity while maintaining a similar price to rivals who only offer WiFi-enabled devices. Huawei’s presence in Asian, European, and Middle Eastern & African markets remains strong.
|
Top Five Tablet Vendors, Shipments, Market Share, and Growth, Third Quarter 2016 (Preliminary Results, Shipments in millions) |
|||||
|
Vendor |
3Q16 Unit Shipments |
3Q16 Market Share |
3Q15 Unit Shipments |
3Q15 Market Share |
Year-Over-Year Growth |
|
1. Apple |
9.3 |
21.5% |
9.9 |
19.6% |
-6.2% |
|
2. Samsung |
6.5 |
15.1% |
8.1 |
16.0% |
-19.3% |
|
3. Amazon.com |
3.1 |
7.3% |
0.8 |
1.5% |
319.9% |
|
4. Lenovo |
2.7 |
6.3% |
3.1 |
6.0% |
-10.8% |
|
5. Huawei |
2.4 |
5.6% |
1.9 |
3.7% |
28.4% |
|
Others |
19.0 |
44.2% |
26.9 |
53.2% |
-29.2% |
|
Total |
43.0 |
100.0% |
50.5 |
100.0% |
-14.7% |
|
Source: IDC Worldwide Quarterly Tablet Tracker, October 31, 2016 |
|||||
Notes:
• Total tablet market includes slate tablets plus detachable tablets. References to “tablets” in this release include both slate tablets and detachable devices.
• Data is preliminary and subject to change.
• Vendor shipments are branded device shipments and exclude OEM sales for all vendors.
• The “Vendor” represents the current parent company (or holding company) for all brands owned and operated as subsidiary.
This chart is intended for public use in online news articles and social media. Instructions on how to embed this graphic are available by clicking here.

