Asia/Pacific* spending on augmented reality and virtual reality (AR/VR) will reach USD7.5 billion in 2019, recording an increase of more than 100% from the previous year, according to the latest IDC Worldwide Semiannual Augmented and Virtual Reality Spending Guide.
IDC expects consumer and enterprise/commercial segments spending in AR/VR products and services to grow at a five-year compound annual growth rate (CAGR) of 81% over the forecast period (2018-23).
IDC predicts a considerable increase in AR/VR spending with the rising investments from distribution & services, and public sectors with the combined spending of $30.7 billion by 2023. Following this, Personal and Consumer Services, Retail, Education and Healthcare industries are the drivers of these sectors, respectively. Amidst, the manufacturing and public sectors will follow closely. In comparison, consumer spending on AR/VR is expected to deliver a five-year CAGR of 70.2% during 2018-23, respectively.
“As new enterprise grade hardware hits the market and several enterprise software companies that offer content development and design tools such as Adobe, PTC and Autodesk, etc. add AR/VR capabilities to their platforms, many enterprises are exploring use of AR/VR for a variety of use cases such as training, maintenance, digital prototyping, architectural designs, retail showcase and remote collaboration,” said Avinav Trigunait, Research Director Future of Work, AR/VR and Mobility. “As organizations prepare for the future of work, the lines between digital and physical continue to blur and commercial spending is expected to further gain momentum over the next few quarters as more projects come out of pilots and hit production driving both headset volumes and more importantly software and services spend,” added Trigunait.
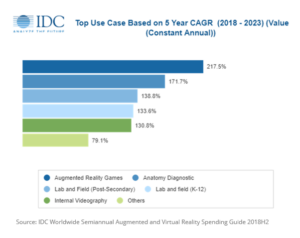
While commercial segment surpassed consumer spending last year and will continue to dominate over the forecast period, virtual reality games are the leading use case garnering around 19.3% of the overall AR/VR spend in 2019, followed by training, and 360 Degree Educational Video Viewing (K-12). However, Augmented Reality Games, Anatomy Diagnostic, and Lab and Field (Post-Secondary) are the fastest growing use case in terms of compound annual growth rate over the forecast (2018-23).
Hardware will account for more than half of all AR/VR spending throughout the forecast followed by software and services. The largest category of hardware spending will be VR host devices, but AR viewers will have the highest growth rate over the forecast period, (CAGR of more than 200%). AR software will be the second fastest growing category, enabling it to overtake VR software spending by 2023. Likewise, services spending is likely to proliferate by CAGRs of AR Consulting services 167.8%. Thereby, the robust growth in AR hardware, software and services spending will drive overall AR spending quite ahead of VR spending by 2023.
AR/VR technology can deal with most of the requirements of the future of businesses in this millennials workforce from facilitating better corporate training experiences to improvise collaboration, giving shape to new ideas to product design and development said,” Ritika Srivastava, Associate Market Analyst at IDC Asia/Pacific. “Furthermore, industries like Personal and Consumer Services, Construction, Education, Retail and Healthcare Provider are expected to be potentially disrupted by this technology with the combined spending of $29.5 billion by 2023,” adds Srivastava.
China market will represent the largest AR/VR spending in the APEJ region with more than 87% share in 2019 and the spending is projected to take off at a five-year CAGR of 84.7% during the forecast period (2018-23). While, AR/VR technology in ASEAN countries of Asia/Pacific (excluding Japan) are slowly gaining trend and experimenting on how AR/VR can improve the industry experience.
The IDC Worldwide Semiannual Augmented and Virtual Reality Spending Guide examines at the AR/VR opportunity and provides insights into this rapidly growing market and how the market will develop over the next five years. Revenue data is available for eight regions, 12 industries, 26 use cases, and eleven technology categories. Unlike any other research in the industry, the comprehensive spending guide was created to help IT decision makers to clearly understand the industry-specific scope and direction of AR/VR expenditures today and in the future.