ICDM, or the International Committee on Display Metrology, met at SID to discuss updates to measurement procedures and to discuss other topics where metrology techniques are still in flux.
One of these areas was contrast measurement. There are two traditional measurements: full on/off white/black screen and a checkerboard pattern. However, neither represents an optimal way to measure contrast.
Measuring the MTF (modulation transfer function) with a series of sinusoidal waves and seeing where the contrast disappears is one accepted way for optical elements that garnered some interest. However, as was pointed out in one presentation, the checkerboard approach is flawed because of the luminance level used in the white segments. These are full white segments, meaning that the average display luminance (ADL) is now at the 50% point.
Recent tests of several types of typical video content suggested that the ADL is much lower. Some have accepted 17% as a good level, but more recent tests suggest it could be more like 10% on a lot of content. That suggests that the white luminance on the checkerboard pattern should be more like 20% (or a full white/black pattern where the white squares represent 20% of the area) to get a better representation of true contrast.
The problem with the 100% luminance points in the contrast measurement is that those white segments light-contaminate the black segments, raising the black level and providing a misleading contrast measurement.
Light field display metrology was also on the agenda, with a gantry-type measurement solution proposed by Rattan Software, which is the processing power behind the Zebra Imaging light field display. Adi Abileah, who leads the ICDM 3D committee, then proposed other methods for measuring holographic light field displays. These approaches will have to be discussed more to develop meaning and agreed-upon methods.
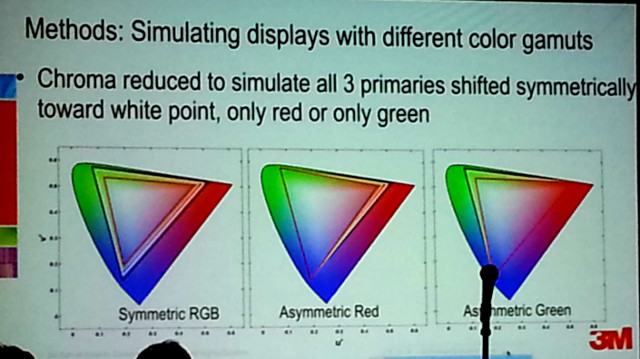
3M described work it did to develop a Display Quality Score (DQS) metric. This was really focused on the perception of colors – and a limited set of colors in the red and green, but the concept has merit for extension to all colors and perhaps other metrics as well.

Dolby’s Scott Daly gave an update on high dynamic range metrology, which overlapped some of the contrast discussion from earlier in the evening. In addition to a contrast measurement with a white and black square pattern (not necessarily a checkerboard) with an agreed upon APL, it may also be useful to simply state the peak luminance and black level of the display.
Chris Chinnock gave a presentation that followed on from his Display Daily article, The Elephant in the Display Metrology Room. His point was that many display measurements don’t accurately represent what we see and the display specs that are marketed to evaluate displays are even worse – if not misleading. This is a big problem and will only get solved if all stakeholders in the space – metrology specialists, panel and product makers, marketers, standards bodies, retails and reviewers – all can agree on a new set of metrics to characterize display performance. That is no small feat. But, a display that is ‘94% accurate for TV viewing’ and offers ‘eye limiting resolution’ are metrics that may be more consumer friendly – and ultimately more accessible and meaningful to end users.

