Worldwide smartphone sales were driven by continued demand for affordable models in emerging markets in Q3’15, says Gartner. Global sales reached 353 million units: up 15.5% YoY.
The increased availability of low-cost smartphones in emerging markets led to small price gaps with feature phones, so an increasing number of consumers upgraded. Of the 353 million smartphones sold in Q3, 259.7 million were sold in emerging markets: 18.4% YoY growth. Mature market sales, meanwhile, rose 8.2% over the same period.
Both Samsung and Apple launched new flagship devices in Q3, while Huawei maintained its growth momentum, in both domestic and international markets – particularly Europe.
| Worldwide Smartphone Sales to End Users by Vendor in Q3’15 (000s) | ||||
|---|---|---|---|---|
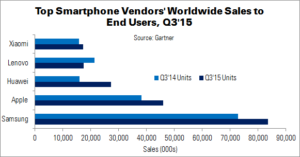
| Vendor | Q3’15 Units | Q3’14 Units | Q3’15 Share | Q3’14 Share |
| Samsung | 83,586.7 | 72,929.4 | 23.7% | 23.9% |
| Apple | 46,062.0 | 38,186.6 | 13.1% | 12.5% |
| Huawei | 27,262.3 | 15,935.0 | 7.7% | 5.2% |
| Lenovo | 17,439.2 | 21,314.1 | 4.9% | 7.0% |
| Xiaomi | 17,197.2 | 15,772.5 | 4.9% | 5.2% |
| Others | 161,296.6 | 141,246.5 | 45.7% | 46.3% |
| Total | 352,844.0 | 305,384.0 | 100.0% | 100.0% |
| Source: Gartner | ||||
Apple’s iOS continued to perform well in the smartphone OS market, growing 21% and reaching a 13.1% market share. Android rose 1.4 percentage points and maintained its market lead (84.7% share), largely thanks to strong sales by Samsung and Huawei. Windows dropped from a 3% share to 1.7%. Research director Roberta Cozza said that, in the future, “Microsoft smartphones will mainly focus on driving value for enterprise users”.
The overall mobile phone market totalled almost 478 million units: a 3.7% rise YoY. Local brands were bolstered by sales in emerging markets. This saw Micromax secure a place in the global top 10, for example. Chinese brands such as ZTE, Huawei, Xiaomi, TCL, Oppo and BBK also became increasingly aggressive in emerging regions.
| Worldwide Mobile Phone Sales to End Users by Vendor in Q3’15 (000s) | ||||
|---|---|---|---|---|
| Vendor | Q3’15 Units | Q3’14 Units | Q3’15 Share | Q3’14 Share |
| Samsung | 102,063 | 93,620 | 21.4% | 20.3% |
| Apple | 46,062 | 38,187 | 9.6% | 8.3% |
| Microsoft | 30,291 | 43,134 | 6.3% | 9.4% |
| Huawei | 27,457 | 16,324 | 5.7% | 3.5% |
| LG Electronics | 18,194 | 21,292 | 3.8% | 4.6% |
| Lenovo | 17,612 | 21,551 | 3.7% | 4.7% |
| Xiaomi | 17,197 | 15,773 | 3.6% | 3.4% |
| TCL | 17,165 | 15,955 | 3.6% | 3.5% |
| ZTE | 13,682 | 13,858 | 2.9% | 3.0% |
| Micromax | 12,165 | 5,645 | 2.5% | 1.2% |
| Others | 176,011 | 175,726 | 36.8% | 38.1% |
| Total | 477,899 | 461,065 | 100.0% | 100.0% |
| Source: Gartner | ||||