The Q2 update of DSCC’s Quarterly Smartphone Display Cost Report includes the latest updates to our smartphone cost model, and a number of new models representing the ongoing evolution of the smartphone marketplace. New panel sizes introduced this quarter include three new flexible OLED models representing phones from Huawei, Oppo, and Samsung, plus revisions for the resolution of Apple’s 2020 iPhone product line, and four 120Hz smartphone panel models.
We continue to modify our view of the China OLED panel makers’ cost structure with some changes this quarter. In our model, we now expect that China costs for personnel and indirect expenses will be 80% of the costs of comparable production in Korea; this ratio was originally 50% but raised to 70% last year. Furthermore, we have reduced the investment calculated for China fabs from 50% of the Korea investment to only 22% of the Korea investment, to recognize the higher value of government subsidies in China for OLED fabs. As per the last update, we assume that over the longer term utilization rates at China OLED panel makers will be the same as at their Korean counterparts, as the oversupply that affects the industry will force these companies to moderate their intake to match demand.
The report uses historical utilization rates up to Q2 2020 and our forecast for fab utilization out to 2024 for both China and Korea fabs. Our forecast for fab UT% is based on an overall view of supply/demand; the substantial oversupply in small-size OLED panel capacity, especially in flexible OLED, will mean that these fabs will have low utilization for some time, but will slowly improve as demand increases.
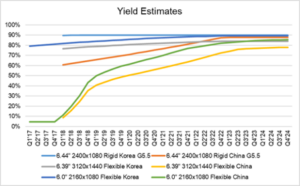
The report also provides DSCC estimates of yields for each smartphone panel; a selection of panels is included in the first chart here, showing the wide gap between Korean (SDC) and Chinese panel makers. We observed that Chinese panel makers made substantial improvements in yield during 2018, but remain far behind Samsung Display even on relatively simple products.
OLED Fab Yield Estimates for Selected Panels
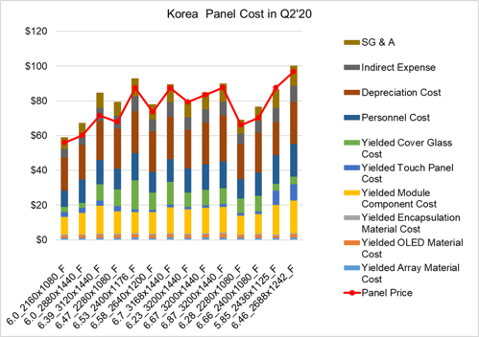
The profitability of Samsung’s OLED operations remains highly dependent on fab utilization, and the Q2 UT% for rigid of only 52% and for flexible of only 38% means that fixed costs such as personnel and depreciation get allocated over a limited volume, and the per piece cost increases such that most panels are made at a loss when considering full costs, as shown in the next chart here. With higher utilization expected in the next two quarters, we expect that Samsung Display’s OLED business will be solidly profitable in the 2nd half of 2020, and for the full year.
Flexible Smartphone Panel Costs/Prices, Korea Production, Gen 6, for Q2 2020
The report allows for detailed comparison of the cost differences between Korea and China fabs, as shown in the next chart of costs for 6.47” FHD+ flexible OLED panels from 2019-2021. Because of relatively high yields, the cost in Korea fabs has been lower overall, but has fluctuated greatly with utilization changes. Because both personnel and depreciation costs are much lower, the costs in China are much less a function of utilization than of yield, which has been steadily improving from very low levels. While the total material cost of panels made in China fabs is substantially higher than those from Korea because of the lower yields, the total cost in 2020 of these panels from China is lower than the cost of panels from Korea production.
Cost / Price for 6.47” FHD+ Panels, Korea Production, 2019-2021
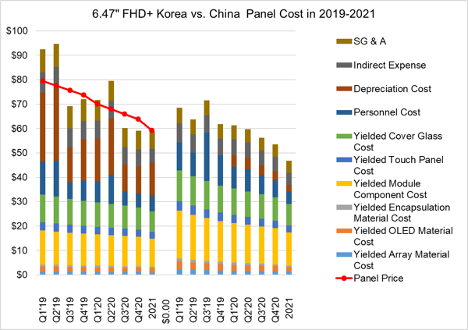
The last bar of the charts represents 2021 costs and prices, and we assume the same UT% for Korea and China fabs at 67.5%. In this outlook, China yields have improved enough such that the higher material costs in China (because of lower yield) are more than offset by lower depreciation, personnel and indirect costs, with the result that China production is 20% lower cost for these types of panels.
The report includes detailed cost profiles for 46 different smartphone panel types, covering rigid and flexible OLED, including sizes from 5.42” to 7.3”, on suitable production lines in both Korea and China.
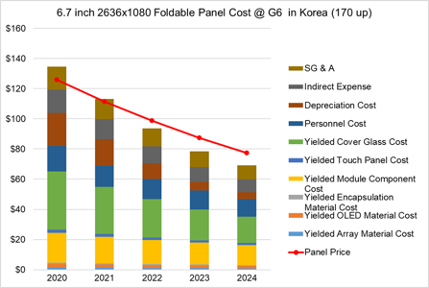
Each quarter we continue to update our analysis of Samsung’s two different foldable phone displays, used in the Galaxy Fold and Galaxy Z Flip smartphones. The cost analysis of the 6.7” panel used in the Z Flip is shown in the next chart. The 6.7” panel with a 22:9 aspect ratio is much smaller in area terms than the 7.3” 4:3 display used in the Galaxy Fold; while the diagonal is only 8% smaller, the 6.7” panel is almost 40% smaller in area terms. This allows an increase from 110 cuts per substrate for the 7.3” panel to 170-up for the 6.7” panel, and a corresponding decrease in costs. Still we expect that the overall low utilization on Samsung’s flexible lines makes this product unprofitable in 2020, but improvements in both yield and utilization improve profitability steadily in the coming years, and we see this panel getting double-digit profit margins in 2023 at panel prices less than $90.
Costs / Prices for 6.7” Foldable Display Panel, Korea Production, 2020-2024
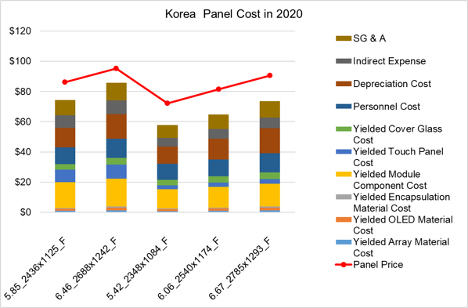
Also this quarter we include updated cost models of the three new products expected in the iPhone product line in 2020, with revisions to the expected resolution of these three panels. Our sources have indicated that we can expect Apple to introduce iPhones at 5.42”, 6.06”, and 6.67” sizes, and that they will continue to sell the 5.85” and 6.46” iPhone XS and XS Max sizes. As the last chart shows, structural improvements allow the 2020 product line to be manufactured at lower costs; the 6.67” cost is 14% lower than the 6.46” cost, even with a larger screen and higher pixel count. The biggest improvement is a switch from force touch to YOCTA, giving a big savings on touch panel cost.
Costs / Prices for iPhone 2020 Display Panels, Korea Production
Subscribers to the smartphone cost report receive an Excel worksheet with all the details of the 46 phone models covered, with quarterly cost estimates to 2024, and a Powerpoint presentation with selected cost highlights including the comparisons given above. DSCC Weekly Review readers who are interested in subscribing to the Quarterly Smartphone Display Cost Report should contact [email protected].