Smartphone shipments will rise 3.1% YoY in 2016: a significant slowdown from the 10.5% growth seen in 2015, and 27.8% in 2014. The forecast is 2.6 percentage points lower than IDC’s previous prediction, and was updated based on the continued slowdown in mature markets and China. Expected shipment figures now stand at 1.48 billion this year and 1.84 billion in 2020.
Some markets, such as the US, Western Europe and China, will experience low single-digit growth this year. Others, however – specifically Canada and Japan – will contract, by 6.9% and 6.4%, respectively. This reflects a change in smartphone buying behaviour. Operator-driven markets are seeing a move away from subsidised two-year contracts towards monthly rolling plans, while retail-heavy markets are increasingly led by online sales.
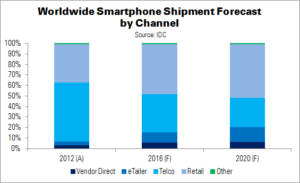
Consumers’ new buying practices are “opening up new doors for OEMs and causing some traditional channels to lose some control of the hardware flow,” said Ryan Reith of IDC. “Smartphones sold into [online sales] channels grew 65% in 2015 and are expected to account for roughly 12% of smartphone shipments in 2016, up from just 4% in 2013. Consumers are having more say over which brands they want and at the same time able to bargain shop.”
Aside from those (few) markets with low smartphone penetration, the focus for smartphones brands has now switched to trying to ensure that smartphone life cycles are not extended further. Early trade-in programmes like Apple’s, as well as a broad range of low-cost unlocked devices, will help to keep mature market life cycles close to two years.
Although single-digit growth is expected for smartphones to 2020, IDC is more positive about phablets (5.5″+ devices). These will enjoy double-digit growth to 2019, slowing to 9.2% in 2020. Vendors continue to push phablets at a variety of price points, although ASPs remain far above regular smartphones: $383 vs $260 this year.
| Worldwide Smartphone Shipments by OS, Market Share and CAGR, 2015-2020 (Millions) | |||||||
|---|---|---|---|---|---|---|---|
| Platform | 2016 Unit Shipments | 2020 Unit Shipments | 2016 Share | 2020 Share | 2016 YoY Change | 2020 YoY Change | 2015-2020 CAGR |
| Android | 1,240.5 | 1,565.3 | 83.7% | 85.1% | 6.2% | 5.3% | 6.0% |
| iOS | 226.8 | 267.1 | 15.3% | 14.5% | -2.0% | 3.5% | 2.9% |
| Windows | 11.2 | 6.8 | 0.8% | 0.4% | -61.6% | -9.5% | -25.3% |
| Others | 4.0 | 0.5 | 0.3% | 0.0% | -55.7% | -9.7% | -43.1% |
| Total | 1,482.5 | 1,839.7 | 100.0% | 100.0% | 3.1% | 5.0% | 5.0% |
| Source: IDC | |||||||
Android will remain the dominant smartphone platform. IDC expects the OS’s market share to grow 6.2% this year, with 1.24 billion shipments and rising to 1.57 billion in 2020. Microsoft’s struggles with Windows smartphones mean that Google’s OS should remain the leading platform for affordability, as well.
IDC expects Android to grow from an 81% share in 2015 to 84% in 2016. ASPs will stand at $218 this year, falling below $200 in 2019. OEMs will continue to build new skins for Android to differentiate their own smartphones.
2016 could be Apple’s first year of falling iPhone shipments: IDC forecasts a decrease of 5 million units, from 232 million in 2015 to 227 million this year. This 2% YoY fall marks a ‘pivotal moment’ for the company. However, IDC expects that Apple can return its smartphone platform to growth in 2017, supported by its early trade-in programme and the lower cost of the iPhone SE. Apple continues to make progress in China, and is trying to break into other high growth markets like India and the Middle East.
The phablet-style iPhone 6+ and 6S+ will continue to grow their share of iPhone shipments, rising from 26% this year to 32% in 2020.
In terms of Windows Phone, Microsoft recently announced the sale of its remaining Nokia assets (Microsoft Sells Off Feature Phone Business). It will continue to support the platform, but will focus on enterprise users. Both of these announcements indicate that Windows Phone will not see a significant volume jump any time soon.

